There are occasions when it is useful to know your bandwidth usage pattern. This not only helps administrators to detect the root cause of traffic related issues, such as a network overload, but also helps them to keep a tab on traffic flow to and from the Internet, and the charges levied by the ISP for the bandwidth used.
This is an important task which requires dedicated and effective software. vnStat is just the tool for that. It is a lightweight (command line) network traffic monitor, which provides several output options like summaries on an hourly, daily, monthly, weekly or top 10 days basis. It can monitor selected interfaces, stores network traffic logs in a database for further analysis and can be used without root permission.
Prerequisites for installation
I have chosen a system with Centos version 6.7 (equivalent to RHEL 6.7) with minimal installation, which acts as a gateway through which eth0 is connected to the Internet and eth1 is connected to the local network. First, install all the required packages and dependencies for vnStat and the PHP Web frontend using the Yum utility.
[root@sun ~]# yum install wget epel-release php httpd php-gd
Installation
To install vnStat, execute the command given below in a terminal:
[root@sun ~]# yum install vnstat
To view all the available interfaces on your system that vnStat can monitor, use the following command:
[root@sun ~]# vnstat --iflist
Available interfaces: lo eth0 eth1
Now add the eth0 and eth1 interfaces for monitoring traffic, as follows:
[root@sun ~]# vnstat -u -i eth0 Error: Unable to read database /var/lib/vnstat/eth0 Info: -> A new database has been created
For the first time, it will display the above error. Ignore this as sufficient data is not available for display.
Similarly, add the second interface, i.e., eth1, as follows:
[root@sun ~]# vnstat -u -i eth1 Error: Unable to read database /var/lib/vnstat/eth1. Info: -> A new database has been created.
Method for updating the database
The database can be updated by either using cron or service.
Cron: To use cron, just remove the comment from /etc/cron.d/vnstat, after which the entry should be as shown below:
#vi /etc/cron.d/vnstat
MAILTO=root
*/5 * * * * vnstat /usr/sbin/vnstat.cron
:wq save and quit
Service: The second method uses vnStatd a program that collects all the information and is run as the daemon. You can start it with executing below command:
[root@sun ~]# /etc/init.d/vnstat start
Enable service at boot time
[root@sun ~]# chkconfig --level 345 vnstat on
To start traffic monitoring for selected interfaces, start vnstat service.
[root@sun ~]# cd /usr/local/src
Download the latest vnStat PHP frontend from http://www.sqweek.com, as follows:
[root@sun src]#wget -c http://www.sqweek.com/sqweek/files/vnstat_php_frontend-1.5.1.tar.gz
Extract the downloaded archive in a Web-accessible directory, e.g. /var/www/html/
[root@sun src]## tar xzf vnstat_php_frontend-1.5.1.tar.gz
[root@sun src]## mv vnstat_php_frontend-1.5.1 /var/www/html/vnstat
Edit the config.php file and set the following parameters as per your set-up:
[root@sun src]#vi /var/www/html/vnstat/config.php $language = en; $iface_list = array(eth0, eth1); $iface_title[eth0] = Public Interface; $iface_title[eth1] = Local interface;
If you are using SELinux, restore the file(s) default SELinux security contexts by using the restorecon command:
[root@sun src]# restorecon -Rv /var/www/html/vnstat/
Make sure that the correct local time zone is set in php.ini. Edit php.ini and set date.timezone =Asia/Kolkata
[root@sun src]#vi /etc/php.ini date.timezone =Asia/Kolkata
Now enable web service at boot
[root@sun src]#chkconfig --level 345 httpd on
Start the Web service httpd as follows:
[root@sun src]#service httpd start
You can access vnStat with the PHP frontend by pointing your browser to http://ipaddress/vnstat, i.e., http://192.168.1.140/vnstat/
Allow port 80 on the server from outside, add rule in iptables by executing below command:
[root@sun src]#/sbin/iptables -A INPUT -m state --state NEW -p tcp --dport 80 -j ACCEPT
[root@sun src]#/etc/init.d/iptables save
[root@sun src]#/etc/init.d/iptables restart
To secure the vnStat PHP frontend with user authentication, add an entry in httpd.conf at the end as shown below:
<Directory /var/www/html/vnstat> AuthUserFile /var/www/vnstat-htpasswd AuthName vnStat user AuthType Basic require valid-user </Directory>
After making changes in the httpd.conf file, restart the httpd service:
[root@sun src]#service httpd restart
Create file /var/www/vnstat-htpasswd
[root@sun src]#touch /var/www/vnstat-htpasswd
[root@sun src]#htpasswd -cm /var/www/vnstat-htpasswd vnadmin
This will add the user, with Force SHA encryption of the password.
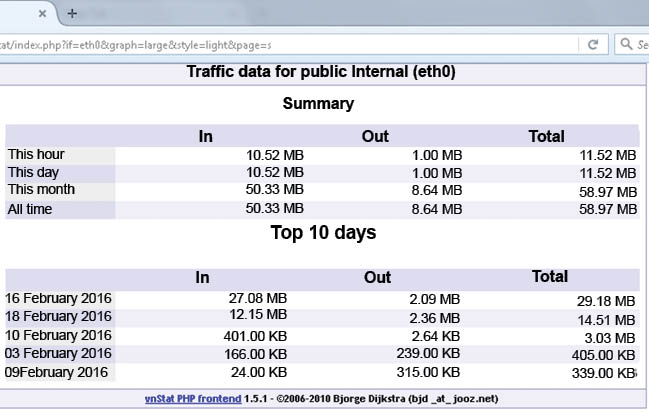
Now point your browser to http://192.168.1.140/vnstat/. It will ask for the user name and password. After entering both, you will be able to see the vnStat PHP frontend main page as shown in Figure 1.
You can get details like the summary, hourly, daily and monthly graphical reports of bandwidth usage for configured interfaces.
References
[1] http://humdi.net/vnstat/
[2] http://linuxaria.com/recensioni/monitot-your-bandwidth-on-linux-with-vnstat>
[3] http://www.sqweek.com/sqweek/index.php
[4] http://www.thegeekstuff.com/2011/11/vnstat-network-traffic-monitor/