


Prometheus is free, open source, no fuss software to monitor computer systems and alert sysadmins. It is a very vital piece of infrastructure software that informs you about the health of your systems. Prometheus can be used very effectively to monitor Docker systems.
Monitoring is an important but often overlooked feature in most applications. At the same time, it is an extremely vital part of infrastructure software – it ensures that you are aware about the health of your systems and whether the important metrics about various services running in your infrastructure are within the acceptable range.
When it comes to Docker, there have been several tools available with its toolset to monitor the health of the system, in addition to the various commercial tools in this space. Here are some expectations from a monitoring solution:
- Simple and unobtrusive to set up
- Extensive integration points and the capability to add more targets to monitor
- Open source, with a thriving community and support ecosystem
- Alerting mechanism
- Visualisation dashboards to understand the health of the system quickly
Prometheus has been gaining popularity over the last few years. It has been promoted to a top level project in the CNCF (Cloud Native Computing Foundation), and has seen significant adoption in the community, where it is used for monitoring infrastructure. It is easy to set up and has a wealth of external connectors (80+) to popular software like MySQL, Redis, NGINX and others, that make it a breeze to integrate metrics from these software into the Prometheus time series database.
Prometheus comes with its own rich metrics format, and for it to integrate any monitoring target, all the target needs to do is expose a metrics endpoint that provides it the metrics data in the Prometheus format.
Docker and Prometheus
Starting with the release of Docker 1.13, an experimental Prometheus metrics-compatible endpoint has been exposed in Docker. What this means is that Prometheus can be set up to monitor a Docker target, and it will be able to integrate the metrics endpoint into its time series database. Once the metrics have been ingested, then the rest of the Prometheus monitoring toolset can be used to visualise the metrics, observe certain metrics and raise alerts if the metrics fall above or below certain threshold values.
Keep in mind that the current support is for monitoring Docker itself and not for the individual applications that are running inside Docker. Over time, we should expect this to happen, as the metrics endpoint in Docker moves from the experimental stage to more general availability. In the next few sections, we will look at how we can configure Prometheus to monitor a Docker set-up.
The prerequisites will be a working Docker set-up on your local machine. This article will not go into the details of setting up a Docker installation, but will assume that you have it running on your local system and that you are able to fire standard Docker commands. You can even use Docker with Windows or Mac as your installation set-up.
Setting up Prometheus
You can download the latest version of Prometheus for your specific operating system from the downloads page on its official website. Simply unzip the file into a folder of your choice and you should see the Prometheus application, i.e., prometheus and the configuration file prometheus.yml present in the folder.
Before we launch the Prometheus server, you will need to set up Docker to expose the experimental metrics endpoint. Depending on your operating system for Docker, i.e., Linux or Windows, you will need to modify the daemon.json file present in the following folders:
- Linux: /etc/docker/daemon.json
- Windows Server: C:\ProgramData\docker\config\daemon.json
You will need to add the following JSON snippet in the daemon.json file, as shown below:
{

“metrics-addr” : “127.0.0.1:9323”,

“experimental” : true

}
Be careful and create the daemon.json file if it is not present. If it is, you should simply add the two lines of code shown above without modifying or changing the other elements in the JSON file.
This ensures that a Prometheus-compatible metrics endpoint will be exposed on port 9323. You will need to start Docker for the changes to take effect and for the metrics endpoint to be available.
Configuring Prometheus to monitor Docker
Now that we have enabled the Prometheus metrics-compatible endpoint in Docker, it is time to configure our Prometheus set-up, so that we can set up targets that we want to monitor. Let’s go for two targets — one can be the standard Prometheus server metrics that are exposed on port 9090 and the other one can be the Docker metrics endpoint that is present on port 9323, which we saw in the earlier section.
A sample prometheus.yml file is shown below:
# global config

global:

scrape_interval: 15s

evaluation_interval: 15s

external_labels:

monitor: ‘docker-monitor’

rule_files:

- job_name: ‘prometheus’

static_configs:

- targets: [‘localhost:9090’]

- job_name: ‘docker-metrics’

static_configs:

- targets: [‘<DockerHostIP>:9323’]
Start the Prometheus application now. A sample output is shown below:
$ .\prometheus

INFO[0009] Starting prometheus (version=1.7.1, branch=master, revision=3afb3fffa3a29c3de865e1172fb740442e9d0133) source=”main.go:88”

INFO[0009] Build context (go=go1.8.3, user=root@0aa1b7fc430d, date=20170612-11:51:33) source=”main.go:89”

INFO[0009] Host details (windows) source=”main.go:90”

INFO[0009] Loading configuration file prometheus.yml source=”main.go:252”

INFO[0009] Loading series map and head chunks... source=”storage.go:428”

INFO[0009] 805 series loaded. source=”storage.go:439”

INFO[0009] Listening on :9090 source=”web.go:259”

INFO[0009] Starting target manager... source=”targetmanager.go:63”
View Prometheus Docker metrics and graphs
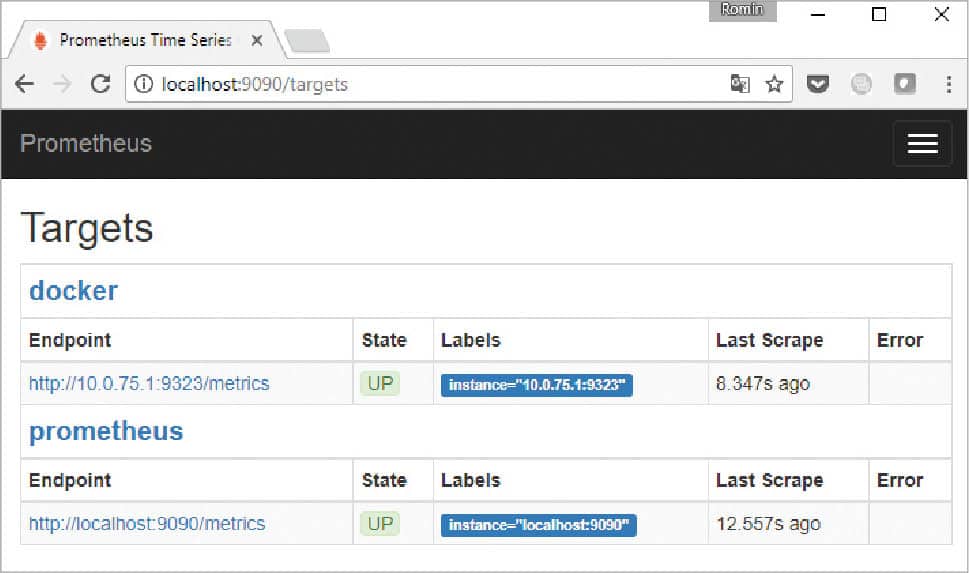
Now that Prometheus has started, we can go to its dashboard, which will be available via the browser on port 9090. Visit the Targets page at localhost:9090/targets and it displays the two targets that we set up for monitoring, as shown in Figure 1.
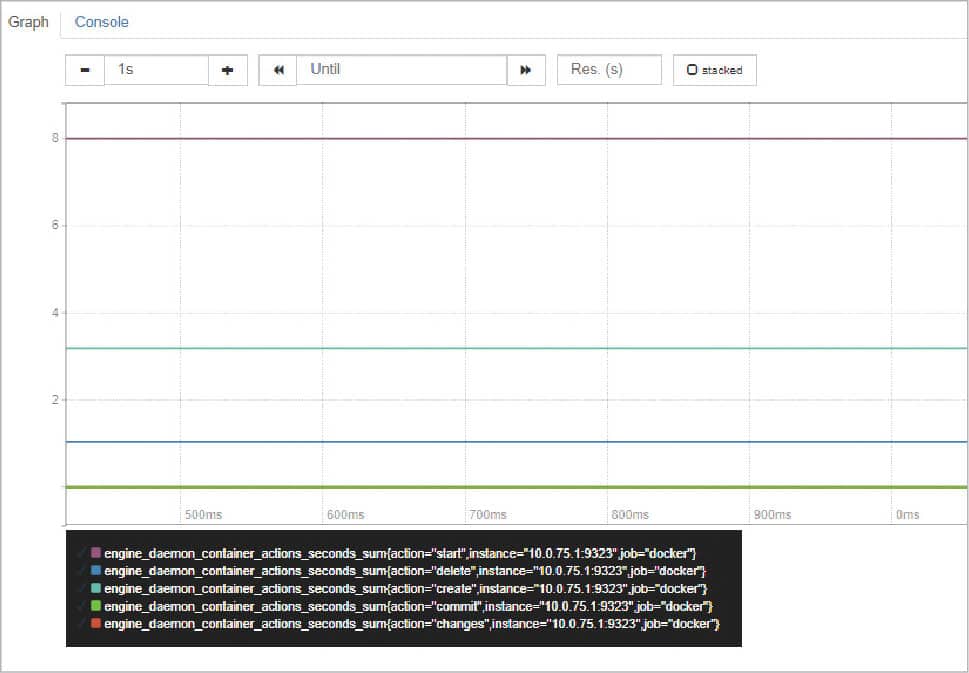
You can click on the Graph option in the main menu and observe multiple Docker metrics. Visit Graph and look at the engine_daemon_* metrics. A sample of one (engine_daemon_container_actions_seconds_sum) is shown in Figure 2.
Monitoring Docker has been a challenge, but with the exposure of metrics endpoints, it has become easier for applications to tap into it and build monitoring/alerting tools around it. The selection of the Prometheus metrics format by Docker is interesting, and goes to validate not just the metadata format but also the ease of use and popularity of the Prometheus tool.


