Tag: visualisation
Speeding Up Data Visualisation with Julia
Today’s real-time applications deal with large volumes of data. The mammoth size of the data makes it mandatory to have powerful visualisation tools. This...
Scientific Graphics Visualisation: An Introduction to PSTricks
To conclude the series of three articles on Scientific Graphics Visualisation, let us explore PSTricks, a set of macros that allows the inclusion of...
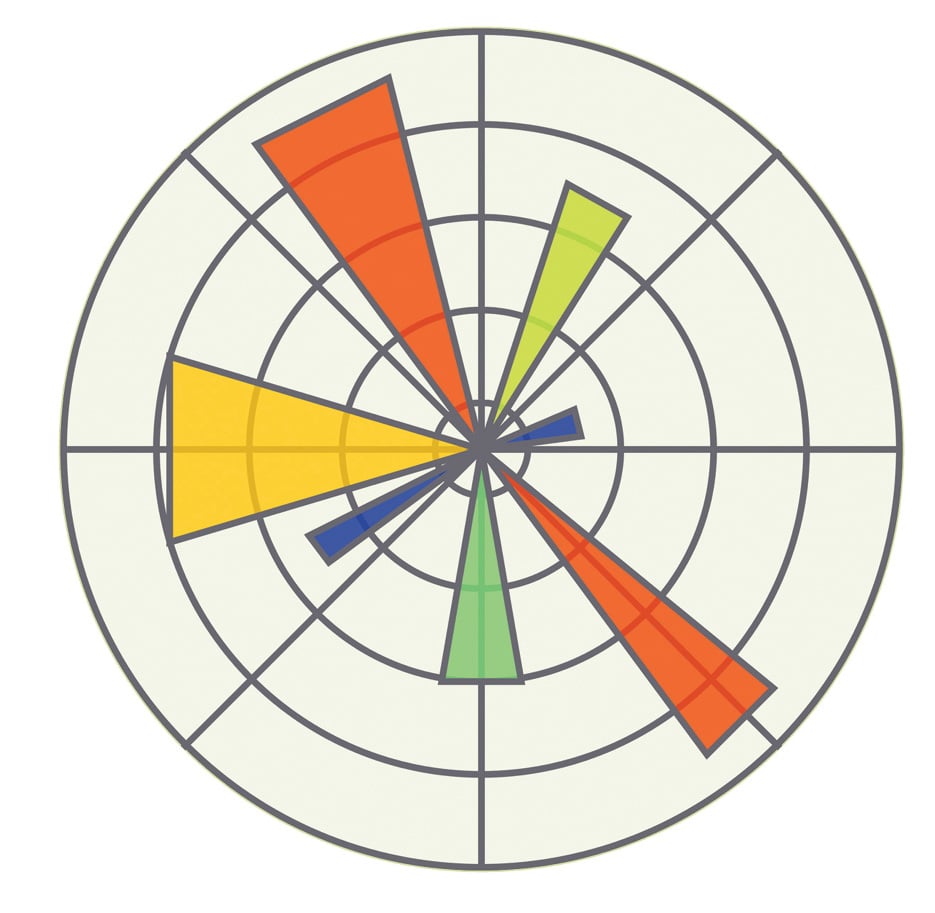
Scientific Graphics Visualisation: An Introduction to Matplotlib
Visualisation is the graphical display of information. Learning and cognition is enhanced by visualisation. While all of us are not born artists, scientific graphics...
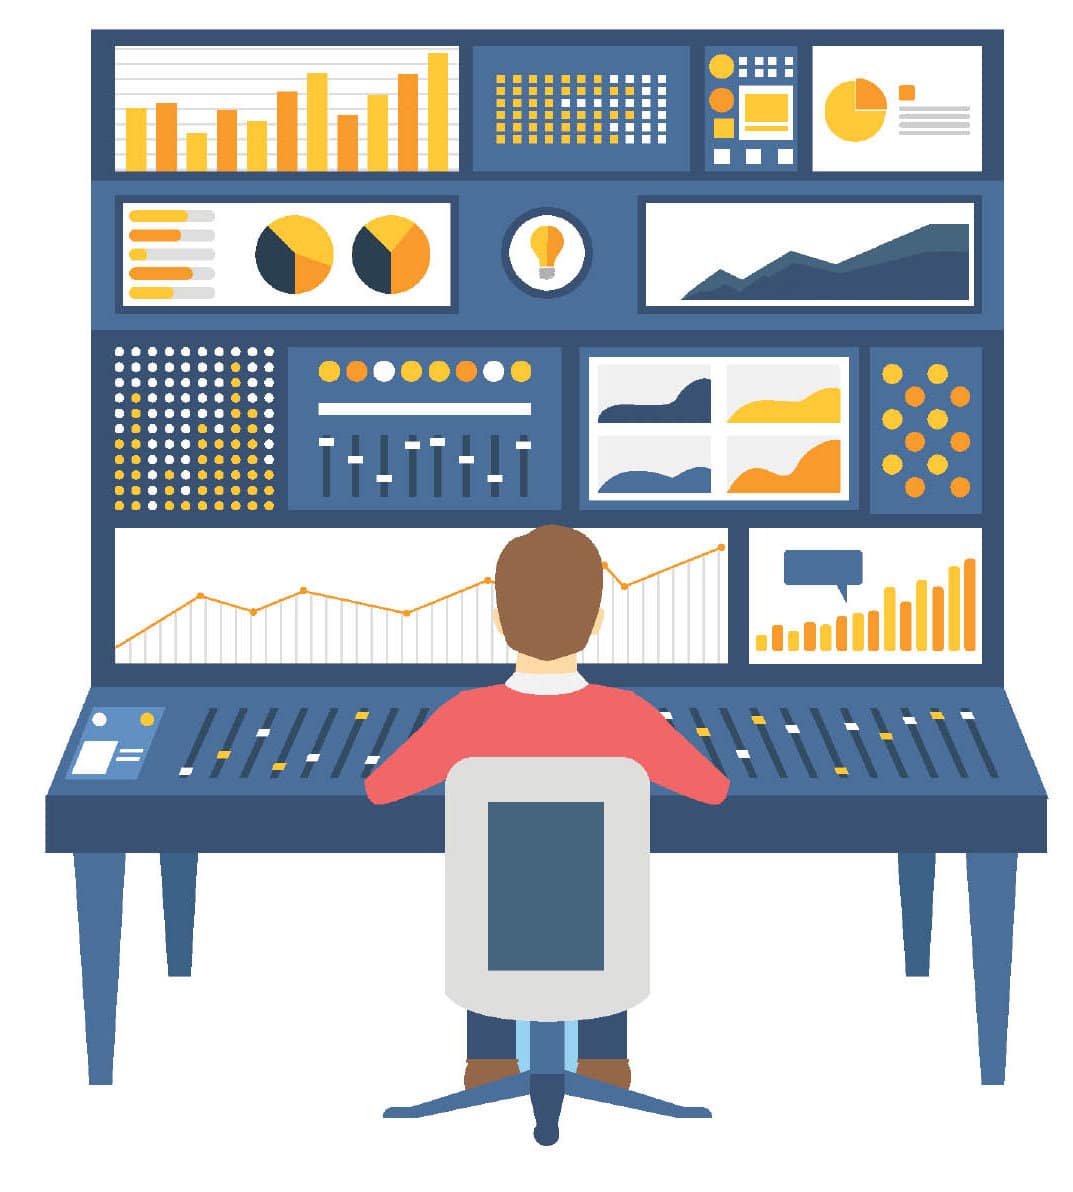
Visualisation Tools in Python
The value of data is enhanced by visualisation. With numerous methods of visualisation available, one would like to choose an option that gives the...
Ganglia for Monitoring Clusters
With the size of an organisation's infrastructure increasing, monitoring is becoming a challenge. Ganglia presents itself as a very good solution when it comes...


