Tag: data visualisation
Data Visualisation In R: Graphs
In this tenth article in the R series, we will continue to explore data visualisation in R with the lattice and ggplot2 packages.
We will...
Plotting Data in R: Graphs
R has a number of packages for plotting graphs and data visualisation, such as graphics, lattice, and ggplot2. In this ninth article in the...
Popular Open Source Tools for Visualisation in AI/ML
Visualisation tools and techniques help to draw insights as well as find trends and patterns in AI/ML projects. Open source tools are convenient and...
Python Libraries for Data Science Simplified
The typical life cycle of a data science project involves jumping back and forth among various interdependent data science tasks using a range of...
Uber offers its data visualisation tech to open source community
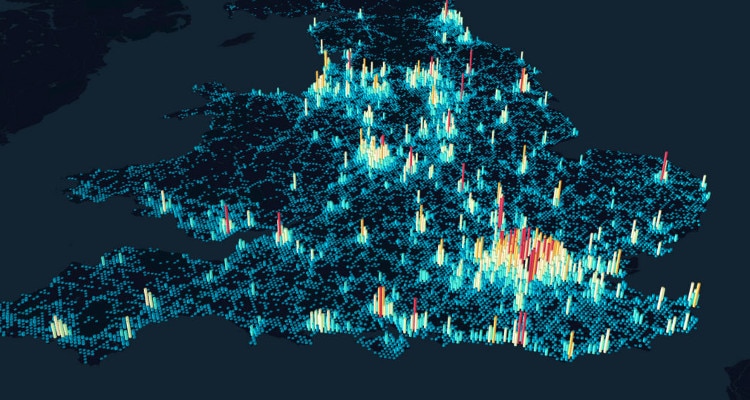
Uber has taken a significant step towards the open source world by releasing the code of its latest data visualisation framework Deck.gl 4.0. The...
Five Python libraries that make data visualisation easy
Data visualisation is an inevitable task, considering the prolific growth in the volume and nature of data that applications need to handle. In such...


