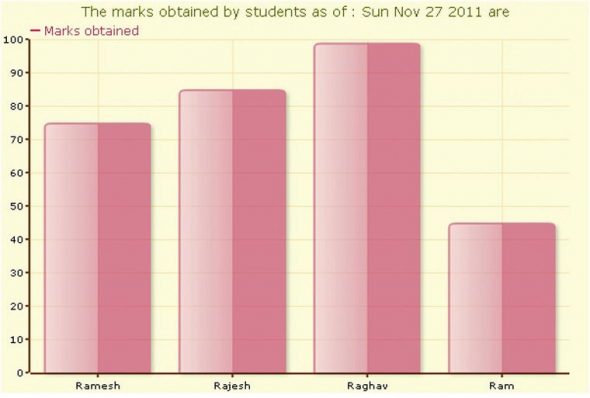
Open Flash Charts (OFC) is an open source charting tool that lets you draw amazing Flash-based graphs on your website. First, let us discuss how to set up the Flash charting component and what the prerequisites are. Then we will move on to drawing a sample bar graph.
The basics
To get up and running with OFC, first download the code library files from the official site. Download the Version 2 “Lug Wyrm Charmer” zip file. This contains the code library for PHP, Ruby, Perl, Python, Java and even .NET, as you can read on the site. We will concentrate on PHP in this article. Unzip the file to the root folder of your site. Once that’s done, we are ready to draw the first graph.
Drawing graphs
Let us try to draw a bar chart that fetches data from a MySQL database. Since the data will be passed to the graph from the database once the graph is completed, it will automatically change, depending on the data in the database, thus providing complete abstraction for the users.
To draw the graph, you need to first decide on the values to be plotted on the X and Y axes. For our sample graph, let us consider a student’s marks table as the data to be plotted on the graph (see table below). Let us plot each student’s marks against the total marks, so there will be four bars in the chart, each corresponding to a student and the marks obtained by him.
| Name | Class | Marks |
| Ramesh | 10 | 75 |
| Ram | 10 | 45 |
| Rajesh | 10 | 85 |
| Raghav | 10 | 99 |
To start plotting the graph, first define a data file, which can fetch data from the database. The data file has an SQL query to actually fetch the data, which is in the form of an array. Now, let us look at a sample data file (BarGraphDataFile.php) to understand how it is constructed.
1 2 3 4 5 6 7 8 9 10 11 12 13 14 15 16 17 18 19 20 21 22 23 24 25 26 27 28 29 30 31 32 33 34 35 36 37 38 39 | <?php$die = false;$link = @mysql_connect('localhost', 'root', '') or ($die = true);if($die){ echo '<h3>Database connection error!!!</h3>'; echo 'A connection to the Database could not be established.<br />'; echo 'Please check your username, password, database name and host.<br />'; echo 'Also make sure <i>mysql.class.php</i> is rightly configured!<br /><br />';}mysql_select_db('test');include_once 'php-ofc-library/open-flash-chart.php';$query = mysql_query('select distinct Marks, Name from test_openflash');While($queryRow = mysql_fetch_array($query, MYSQL_ASSOC)){ $dataForGraph[] = intval($queryRow['Marks']); $XAxisLabel[] = $queryRow['Name'];}$title = new title( 'The marks obtained by students as of : '.date("D M d Y").' are' );$title->set_style( '{color: #567300; font-size: 14px}' );$chart = new open_flash_chart();$chart->set_title( $title );$x_axis_labels = new x_axis_labels();$x_axis_labels->set_labels($XAxisLabel);$y_axis = new y_axis();$x_axis = new x_axis();$y_axis->set_range( 0, 100, 10 );$x_axis->set_labels ($x_axis_labels);$chart->set_x_axis( $x_axis );$chart->add_y_axis( $y_axis );$bar = new bar_glass();$bar->colour('#BF3B69');$bar->key('Marks obtained', 12);$bar->set_values($dataForGraph);$chart->add_element($bar);mysql_close($link);echo $chart->toPrettyString();?> |
Now, look at the code to understand what is happening.
First, you opened a database connection to fetch the data. Upon successfully connecting, you included the OFC PHP file to get the required function definitions. You then proceeded to actual data fetching via an SQL query that gets the distinct names and corresponding marks obtained by students. You stored the data in two arrays, one holding the marks (dataForGraph), the other the student name (XAxisLabel). The arrays are named based on their usage, since the marks will be the actual data to draw the graph and the names will be used to label the X axis.
You then created a title object, set its colour and font size, then created a chart object and assigned the title object as the chart title. Next, the X axis label object was created and you set the values by passing the XAxisLabel array. Then the X axis and Y axis objects were created. Finally, a bar object was created and the data in the dataForGraph array was passed to it. The last line formats the data so that it can be used by the OFC components.
Next, we have to create the file that displays the graph. This is quite simple with the following code:
<html><head><script type="text/javascript" src="js/swfobject.js"></script><script type="text/javascript">swfobject.embedSWF( "open-flash-chart.swf", "bar_chart", "600", "400", "9.0.0", "expressInstall.swf", {"data-file":" BarGraphDataFile.php "} );</script></head><body> <div id="bar_chart"></div></body></html> |
Save this file as Reports.html. In this file, we have included the JS and SWF files required for plotting the graph. The data file is also passed here so that it can be invoked to get the data required to plot the graph. When viewed in the browser, the chart is as shown in Figure 1.

There are many more graphs you can draw using OFC — pie charts, line graphs and others. In the next article in this series, I will cover the drawing of a sample pie chart and will provide more insights into what OFC has to offer. Feedback and queries are welcome.


Nice article indeed.
[…] CommentsIn the earlier parts of this series, we looked at using Open Flash Charts (OFC) to create great-looking bar charts and pie charts. In this part, let us look at how to create line charts and draw multiple line […]
Very good! I was a little frustrated with the OFC mysql tutorial on the official OFC website, but your article helped a lot!
excellent man you don´t know how you helped me
Regarding graph on the top, it may impress some customers but certainly repels other: 3D is redundant, the ratio red/yellow in the pie is distorted. Figure 1 is much better but flash is already dead!