Linux systems administrators need a number of tools to keep their systems well-oiled and running smoothly at peak efficiency levels. Here is a set of ten tools which will help them, whether they are newbies or veterans getting a refresher course.
A systems administrator’s job is complex, covering responsibilities that range from managing systems to intrusion detection. Thankfully, the world of open source software provides a comprehensive set of tools to simplify admin tasks. The following list of ten key open source tools covers all the bases.
1. Cockpit
Cockpit is software developed by Red Hat that provides an interactive browser based Linux administration interface. Its graphical interface allows beginner system administrators to perform common sysadmin tasks without the requisite skills on the command line. In addition to making systems easier to manage for novice administrators, Cockpit also makes systems configuration and performance data accessible to them, even if they do not know command line tools. It is available via the Cockpit package in the Red Hat Linux 7 extras repository. You can install Cockpit using the following command:
# yum –y install cockpit.-
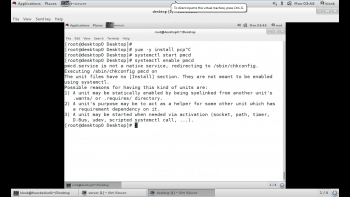
Once installed on a system, Cockpit must be started before it can be accessed across the network, as shown below. Cockpit can be accessed remotely via HTTPS using a Web browser and by connecting to TCP Port 9090. This port must be opened on the system firewall for Cockpit to be accessed remotely. It is defined as the Cockpit for firewalls.
# systemctl start cockpit

# firewall-cmd --add-service=cockpit --permanent

# firewall-cmd --reload
Once the connection is established with the Cockpit Web interface, a user must be authenticated in order to gain entry. Authentication is performed using the system’s local OS account database. The dashboard screen in the Cockpit interface provides an overview of the core system’s performance metrics. Metrics are reported on a per second basis, and allow the administrator to monitor the use of subsystems such as the CPU, memory, network and disk.
2. PCP
Red Hat Enterprise Linux 7 includes a program called Performance Co-Pilot, provided by the PCP RPM package. Performance Co-Pilot, or PCP, allows the administrator to collect and query data from various subsystems. It is installed with the pcp package. After installation, the machine will get the pmcd daemon, which is necessary for collecting the subsystem data. Additionally, the machine will also have various command line tools for querying system performance data.
There are several services that are part of PCP but the one that collects systems performance data locally is pmcd, or the Performance Metrics Collector Daemon. This service must be running in order to query performance data with the CP command line utilities. The pcp package provides a variety of command line utilities to gather and display data on the machine.
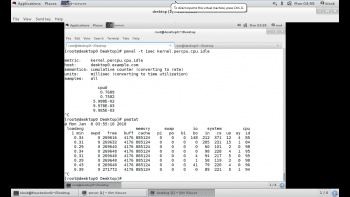
The pmstat command provides information similar to vmstat. pmstat supports options to adjust the interval between collections (-t) or the number of samples (-s).
The pmatop command provides a top like output of machine statistics and data. It includes disk I/O and network I/O statistics, as well as CPU memory and process information provided by other tools. By default, pmatop will update every 5 seconds.
The pmval command is used to obtain historical statistics of per CPU idle time at one minute intervals from the most recent archive log.
3. Puppet
Puppet allows the systems administrator to write infrastructure as code using a descriptive language to configure machines, instead of using individualised and customised scripts to do so. Puppet’s domain-specific language is used to describe the state of a machine, and Puppet can enforce this state. This means that if the administrator mistakenly changes something on the machine, Puppet can enforce the state and return the machine to the desired state. Thus, not only can the Puppet code be used to configure a system initially, but it can also be used to keep the state of the system in line with the desired configuration.
Puppet architecture: Puppet uses a server/client model. The server is called a Puppet master and it stores recipes and manifests for the clients. The clients are called Puppet nodes and run the Puppet agent software. These nodes normally run a Puppet daemon that is used to connect to the Puppet master. The nodes will download the recipe assigned to the node from the Puppet master and apply the configuration if needed.
Configuring a Puppet client: Although Puppet can run in standalone mode, where all Puppet clients have Puppet modules locally that are applied to the system, most systems administrators find that this tool works best using a centralised Puppet master. The first step in deploying a Puppet client is to install the Puppet package.
# yum –y install puppet
Once the Puppet package is installed, the Puppet client must be configured with the host name of the Puppet master. The host name of the Puppet master should be placed in the
/etc/puppet/puppet.conf file under the [agent] section as shown below. First open the configuration file of Puppet, and then make entries as shown, before saving the file.
# vim /etc/puppet/puppet.conf

[agent]

Server=puppet.demo.example.com
The final step to be taken on the Puppet client is to start the Puppet agent service and configure it to run at boot time.
# systemctl start puppet.service.

# systemctl enable puppet.service.
4. AIDE
System stability is put at risk when configuration files are deleted or modified without authorisation or careful supervision. How can a change to an important file or directory be detected? This problem can be solved by using intrusion detection software to monitor files for changes. Advance Intrusion Detection Environment or AIDE can be configured to monitor files for a variety of changes including permissions or ownership changes, timestamp changes, or content changes.
To get started with AIDE, install the RPM package that provides the AIDE software. This package has useful documentation on tuning the software to monitor the specific changes of interest.
# yum –y install aide.
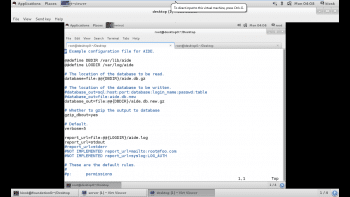
Once the software is installed, it needs to be configured. The /etc/aide.conf file is the primary configuration file for AIDE. It has three types of configuration directives: configuration lines, selection lines and macro lines.
Configuration lines take the form param=value. When param is not a built-in AIDE setting, it is a group definition that lists which changes to look for. For example, the following group definition can be found in /etc/aide.conf, which is installed by default:
PERMS = p+i+u+g+acl+selinux
The aforesaid line defines a group called PERMS that looks for changes in file permissions (p), inode (i), user ownership (u), group ownership (g), ACLs (acl), or SELinux context (selinux). We can write our own parameters in the file which can be used to monitor our systems.
Selection lines define which checks are performed on matched directories.
The third type of directive is macro lines — these define variables and their definition has the following syntax.
@@define VAR value
Execute the aide –init command to initialise the AIDE database. After the database is created, a file system check can be performed using the aide –check command. This command scans the file system and compares the current state of files with the information in the earlier AIDE database. Any differences that are found will be displayed, showing both the original file’s state and the new condition.
5. Mcelog
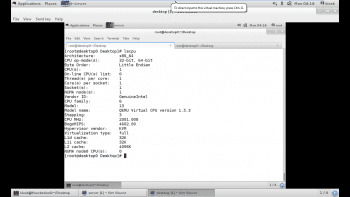
An important step in troubleshooting potential hardware issues is knowing exactly which hardware is present in the system. The CPU(s) in a running system can be identified from the lscpu command, as shown in Figure 4.
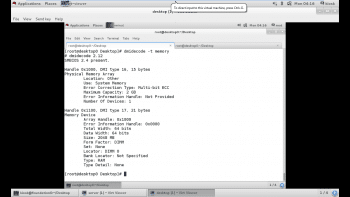
The dmidecode tool can be used to retrieve information about physical memory banks, including the type, speed and location of the bank as shown in Figure 5.
Modern systems can typically keep a watch on various hardware failures, alerting an administrator when a hardware fault occurs. While some of these solutions are vendor-specific and require a remote management card, others can be read from the OS in a standard fashion. RHEL 7 provides mcelog for logging hardware faults, which provides a framework for catching and logging machine check exceptions on x86 systems. On supported systems, it can also automatically mark bad areas of RAM so that they will not be used.
Install and enable mcelog as shown below:
# yum –y install mcelog.

# systemctl enable mcelog.

#systemctl start mcelog.
From now on, hardware errors caught by the mcelog daemon will show up in the system journal. Messages can be queried using the journalctl –u mcelog service. If the abort daemon is installed and active, it will also trigger on various mcelog messages. Alternatively, for administrators who do not wish to run a separate service, a cron is set up but commented out in /etc/cron.hourly/mcelog.cron that will dump events into /var/log/mcelog.
6. Memtest86+
When a physical memory error is suspected, an administrator might want to run an exhaustive memory test. In such cases, the Memtest86+ package must be installed. Since the memory test in a live system is more than ideal, the Memtest86+ package will install a separate boot entry that runs Memtest86+ instead of the regular Linux kernel. The following steps outline how to enable this in the boot entry:
1.) Install the Memtest86+ package and this will install the Memtest86+ application into /boot.
2.) Run the command memtest-setup. This will add a new template into /etc/grub.d to enable Memtest86+.
3.) Update the Grub2 boot loader configuration as shown below:
# grub2-mkconfig –o /boot/grub2/grub.cfg.
7. Nmap
Nmap is an open source port scanner that is provided by the Red Hat Enterprise Linux 7 distribution. It is a tool that administrators use to rapidly scan large networks but it can also do a more intensive port scan on individual hosts. Nmap uses the raw IP package in novel ways to determine what hosts are available on the network, what services those hosts are offering, what OS they are running, what type of packet filters/firewalls are in use and dozens of other characteristics.
The nmap package provides the nmap executable.
# yum –y install nmap
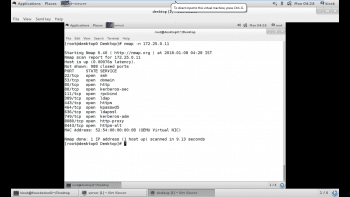
The example given in Figure 6 shows Nmap scanning the network. The –n option instructs it to display host information numerically, not using DNS. As Nmap discovers each host, it scans privileged TCP ports looking for services. It displays the MAC address, with the corresponding network adapter manufacturer of each host.
8. Wireshark
Wireshark is an open source, graphical application for capturing, filtering and inspecting network packets. It was formerly called Ethereal, but because of trademark issues, the project’s name was changed. Wireshark can perform promiscuous packet sniffing when network interface controllers support it. RHEL 7 includes the wireshark-gnome package. This provides Wireshark functionality on a system installed with X.
#yum –y install wireshark-gnome.
Once Wireshark is installed, it can be launched by selecting Applications > Internet > Wireshark Network Analyzer from the GNOME desktop. It can also be launched directly from the shell using the following command:
# wireshark
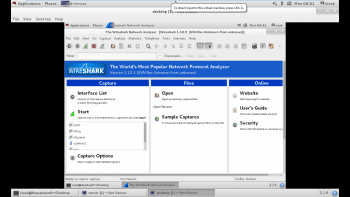
Wireshark can capture network packets. It must be executed by the root user to capture packets, because direct access to the network interface requires root privileges. The capture option in the top level menu as shown in Figure 7 permits the user to start and prevent Wireshark from capturing packets. It also allows the administrator to select the interface to capture packets on. The ‘any’ option in the interface list matches all of the network interfaces.
Once packet capturing has been stopped, the captured network packets can be written to a file for sharing or later analysis. The File>Save>… or File > Save as… menu item allows the user to specify the files to save the packet into. Wireshark supports a variety of file formats.
9. Kdump
RHEL offers the Kdump software for the capture of kernel crash dumps. This software works by using the kexec utility on a running system to boot a secondary Linux kernel without going through a system reset. The Kdump software is installed by default in RHEL 7 through the installation of the kexec-tools package. The package provides the files and command line utilities necessary for administering Kdump from the command line.
# yum –y install kexec-tools system-config-kdump.
The Kdump crash dump mechanism is provided through the kdump service. Administrators interested in enabling the collection of kernel crash dumps on their systems must ensure that the kdump service is enabled and started on each system.
# systemctl enable kdump.

# systemctl start kdump.
With the kdump service enabled and started, kernel crash dumps will begin to be generated during system hangs and crashes. The behaviour of the kernel crash dump and collection can be modified in various ways by using the /etc/kdump.conf configuration file.
By default, Kdump captures crash dumps locally to crash dump files located in subdirectories under the /var/crash path.
10. SystemTap
The SystemTap framework allows easy probing and instrumentation of almost any component within the kernel. It provides administrators with a flexible scripting language and library by leveraging the kprobes facility within the Linux kernel. Using kprobes, kernel programmers can attach instrumentation code to the beginning or end of any kernel function. SystemTap scripts specify where to attach probes and what data to collect when the probe executes.
SystemTap requires symbolic naming for instructions within the kernel. So it depends on the following packages, which are not usually found on production systems. These packages will pull in any required dependencies. The packages are:
1) Kernel-debuginfo
2) Kernel-devel
3) Systemtap
Using stap to run SystemTap scripts: The SystemTap package provides a variety of sample scripts that administrators may find useful for gathering data on their systems. The scripts are stored in /usr/share/doc/systemtap-client-*/examples. These scripts are further divided into several different subdirectories based on what type of information they have been asked to collect. SystemTap scripts have an extension of .stp.
To compile and run these example scripts, or any other SystemTap script for that matter, administrators use the stap command.






Thank you for the article.
Where does Ansible fit into your top tools for OpenSource Admins? Puppet is good but Ansible goes further.