The versatile Wireshark tool can be put to several uses. This article presents a tutorial on using Wireshark to discover and visualise the response time of a Web server.
Wireshark is a cross-platform network analysis tool used to capture packets in real-time. Wireshark includes filters, flow statistics, colour coding, and other features that allow you to get a deep insight into network traffic and to inspect individual packets. Discovering the delayed HTTP responses for a particular HTTP request from a particular PC is a tedious task for most admins. This tutorial will teach readers how to discover and visualise the response time of a Web server using Wireshark. OSFY has published many articles on Wireshark, which you can refer to for a better understanding of the topic.
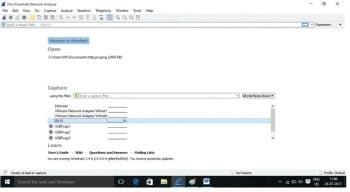
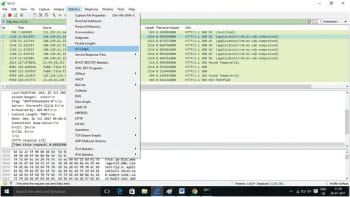
Step 1: Start capturing the packets using Wireshark on a specified interface to which you are connected. Refer to the bounding box in Figure 1 for available interfaces.
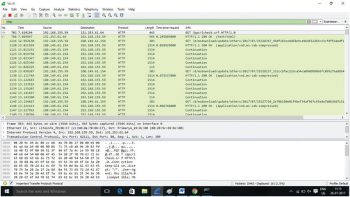
Step 2: Here, we make a request to http://www.wikipedia.org and, as a result, Wikipedia sends an HTTP response of ‘200 OK’, which indicates the requested action was successful. ‘200 OK’ implies that the response contains a payload, which represents the status of the requested resource (the request is successful). Now filter all the HTTP packets as shown in Figure 2, as follows:
syntax: http |
Step 3: We now filter the requests and response sent from the local PC to Wikipedia and vice versa. Start filtering the IP of www.wikipedia.org (a simple traceroute or pathping can reveal the IP address of any Web server) and your local PC IP (a simple ipconfig for Windows and ifconfig for Linux can reveal your local PC IP).
Syntax: ip.addr== 91.198.174.192 && ip.addr == 192.168.155.59 |
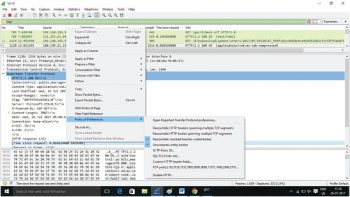
Step 4: In order to view the response of HTTP, right-click on any response packet (HTTP/1.1). Go to Protocol preference and then uncheck the sub-dissector to reassemble TCP streams (marked and shown in Figure 3).
- If the TCP preference ‘Allow sub-dissector to reassemble TCP streams’ is off, the http.time will be the time between the GET request and the first packet of the response, the one containing ‘OK’.
- If ‘Allow sub-dissector to reassemble TCP streams’ is on and the HTTP reassembly preferences have been left at their defaults (on), http.time will be the time between the GET request and the last packet of the response.
- Procedure: Right-click on any HTTP response packet -> Protocol preference -> uncheck ‘Reassemble HTTP headers spanning multiple TCP segments’ and ‘Reassemble HTTP bodies spanning multiple TCP segments’.
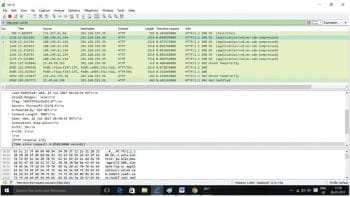
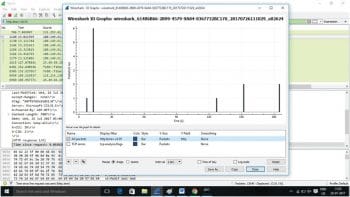
Step 5: Create a filter based on the response time as shown in Figure 4, and visualise the HTTP responses using an I/O graph as shown in Figure 5.
Syntax: http.time >= 0.050000 |
Step 6: To calculate the delta (delay) time between request and response, use Time Reference (CTRL-T in the GUI) for easy delta time calculation.
Step 7: In order to display only the HTTP response, add a filter http.time >=0.0500 in the display filter. The graph, as shown in Figure 6, depicts the result of the HTTP responses (delta time).


