What do you do when you’ve just set up a network and the basic stuff is all fine, but something is still wrong. For instance, you’re able to ping one host, but not another? Or connectivity to some sites is slow, though to most other sites it appears to be fast enough, and your ISP say it’s not their headache?
In this article, we’ll run through some of my favourite tools for network troubleshooting. If you’re a network admin, you might find these tools useful. However, I have tried, as usual, to favour concepts and description over detailed command information, so even a normal home user might find this article interesting as a casual read. I expect anyone with a serious interest in one of the tools to check out the man pages or other documentation anyway.
All at sea
I’m an avid quizzer, as I’m sure some of you are. I sometimes conduct quizzes too, and one of my favourite questions is: what is the connection between the Sonar equipment used in a submarine and modern networking? Of course, it’s the humble ping command, which was named after the sound that a Sonar makes in a submarine. If you’ve seen Hunt for Red October you’ll know :-) So, continuing the marine theme, ping is the first port of call when you have a network problem, and naturally, everyone knows how to use it to check if some host is up.

But is that all ping can do? Even in the normal run, there’s important information. Figure 1 shows a typical ping output.
There’s a very important number that ping shows, called the ‘round trip time’ (RTT). RTT is a measure of how close a host is to you, based on how long it takes a packet to go out and come back again. RTT on a LAN tends to be less than a millisecond, while 2-3 milliseconds (as in Figure 1) is more typical of a wireless network. RTTs on WAN links are more in the 200-600 millisecond range, reflecting the number of routers that they have to go through.
ping can also get you clued into an unreliable connection, by showing a packet loss in the status line (the last line but one above). For instance, it might say “50 packets transmitted, 47 received, 6% packet loss, time 44754ms,” which would indicate a pretty bad connection.
But this information only shows up at the end, after you kill ping. What if you want to keep the ping running for a while and continuously see how reliable the connection is? Well, you can watch the ICMP sequence number to make sure it increases exactly by one and doesn’t skip a few, but that’s too tedious to keep up for a long time. I mean, that’s what computers are for, right—to do the tedious stuff? So can the humble ping command do anything more?
Turns out it can, and in a very imaginative and simple way! The command to use is ping -f -i 1 host. With the -f option, ping prints a “.” for every outgoing packet and a back-space for every reply. Thus the number of dots on the display is the number of ping packets that have not yet been acknowledged by the remote side. A fast and reliable connection will not show you a single dot—every dot will be cancelled by a back-space well before the next dot appears, so the cursor sits on the left of the screen and nothing seems to be happening.
If you see the number of dots increasing gradually, you know there are packet losses happening on the link. It’s actually a pretty cool display, but in order to see it, you have to test it against an unreliable server or an unreliable network. For most home users, the best way to do this is to use a laptop to ping a wireless router, and gradually move the laptop further and further away from the access point.
When you use -f, don’t forget the 1-second interval flag (-i 1). Otherwise, you get what is called a ‘flood ping’, which can look like a Denial of Service attack to the target host, and they might complain (or worse, retaliate). In fact, a fast machine on a fast network can bring down a network using a ‘flood ping’ without an interval specified! However, if the target host is yours or you have permission to do so, it can be fun to try something like ping -f -c 500 -s 1400 host. The laptop + wireless method of simulating a flaky connection is really useful to see this in action. Also, try different values for the packet size (the -s option).
This is not just fun—you’ll start to recognise that this simple dot pattern can clue you into troublesome connections very quickly, although once again, I must repeat that -f without -i 1 should be used very carefully and sparingly, and only on your own hosts.
Who’s dropping the ball?
So you have a flaky connection to your office network…and your VPN keeps dropping off. Or your YouTube feed is constantly stopping to buffer; I mean, we know which is more likely, right?
A ‘flood ping’ tells you there are lots of dropped packets but doesn’t tell you where or who’s responsible. If you’ve ever done a traceroute, you know there are multiple hosts in between yourself and the target, and it may be useful to know where among these hops the packet loss is occurring.

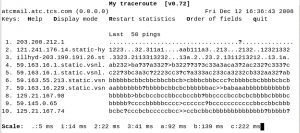
This is what mtr shows you: it shows where the packet loss is happening, in real time, using ICMP ECHO requests (i.e., ping packets). It’s one of the best tools for figuring out where the problems are, with a simple but really useful display, including a quick online help screen. The default screen looks like Figure 2, once it’s started up, though, of course, it’s continuously updating.
You can quickly see which intermediate router is losing the most packets, as well as which ones are taking the most amount of time to reply. An even more useful display is obtained by hitting j, which shows you packet loss in absolute numbers instead of percentages. More importantly, it also shows you something called ‘jitter’, which means inconsistency in response times. You can also think of jitter as a measure of transient or occasional congestion in that link, causing only delays for now, though if the quality degrades further, there may be packet loss too. Seasoned travellers know that when too many flights show a ‘delayed’ status, sooner or later some will go from ‘delayed’ to ‘cancelled’—this is pretty much the same thing.

The best feature of mtr can be seen by cycling the display mode (by pressing d). This is a very interesting display, showing the actual timing results from the last 50 ping sequences (or more, if your screen is wider). A “.” means a reply was received, a “>” means it was received but took a long time, and a “?” means it has not been received yet. If you cycle the display mode again, the display changes to show 6 levels of granularity in the RTT, and a scale at the bottom to say what these levels mean. For example, in Figure 3, a “1” means a reply was received more than 5 but less than 14 ms later, and a “>” means a response packet was received more than 222 ms later.
This is a very cool display—and I can tell you from personal experience that it never fails to impress when you’re trying to prove to someone that the problem is on their router! Most Windows-type admins are left speechless—although that’s probably because they are trying to digest the fact that you don’t need a bloated GUI framework to get useful work done!
Moving up a layer or two
However, it often happens that the system we are trying to trace does not accept ICMP (pings) or UDP (traceroute)—most security conscious admins disable everything that is not absolutely needed, and if it’s a public Web server, it may only allow HTTP/HTTPS (ports 80/443). For times like this, you could just use the traceroute’s -T option, which uses TCP instead of UDP. It works pretty well, although this is not a continuously running program, so it tells you about connectivity and RTT for one round only.

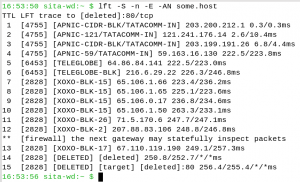
However, we may want to find out who owns a particular network. When you need that, lft (Layer Four Trace) is pretty useful. Above and beyond what traceroute can do, lft can show if there are any firewalls in between, as well as what organisation owns those gateways or routers, as you can see in Figure 4.
Thinking local; iftop and iptraf
So let’s say you’ve figured out who or what is slowing down your packets and (hopefully) got someone to fix it. Your traffic is moving pretty smoothly, and everyone is happy.
Actually, some people are too happy—they’re hogging all the bandwidth! You need to find out who they are and have a quick word with them. The only question is: who is hitting the net so badly and what site are they hitting?
Even if you’re not a Simon Travaglia, and you have only your own machine to worry about, perhaps you suddenly noticed a lot of activity on the network monitor (you do use one, right? I suggest conky for low-end machines and gkrellm for all others!) and you’re wondering what program is doing it and why.
While netstat can certainly be used to give you this sort of information, there is another tool that has become a very useful part of my toolkit now, which is called iftop. It’s a pretty old tool, and it hasn’t been updated in a couple of years, but don’t let that stop you from trying it.

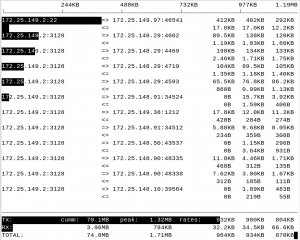
iftop is an interactive program with a number of cool features, all of them accessible by typing some key, and it has a quick one-screen online help in case you forget the keys. Running ifopt -nNPB on a lightly-loaded system might look like the output shown in Figure 5.
The display is quite self-explanatory, except for the last three columns in the main display. These are averages of the data transferred over the previous 2, 10 and 40 seconds, respectively.
The black bars are important. Across the very top is the ‘scale’ for all the bars, and the bars actually represent the 10-second average (the middle column) by default, although pressing “B” will cycle between 2, 10, and 40-second averages. This way you get a visual indication of what hosts and ports are hogging the traffic.
You can do some cool things here—you can choose to look only at outgoing or incoming traffic or perhaps the sum of the two (press t to cycle between these modes). You can aggregate all traffic for each source into one line by pressing s, and for each destination by pressing d. Be sure to read the online help as well as the man page—it’s worth it.
What’s even more cool is that there are two filters to limit the output. Typing l enables a ‘display filter’—the pattern or string you enter will be applied to the host+port field and used to filter lines appearing in the display. This is a literal match: for example, if you type “pop3” as the search filter, then use “N” to disable port number resolution, you’ll have to change the search string to “:110” in order for it to match. The same goes for host names versus IP addresses.
Using l only affects the display; the totals still count all the traffic. On the other hand, you can use f to set a packet filter condition that will stop traffic that does not match, from even coming into the program. For instance, you can type “f” then “port 25” to see only SMTP traffic. This filter can take quite complex conditions, using the same syntax that popular tools like tcpdump, etc, use. Plus, this filter can be specified from the command line too, like:
iftop -nBP -f ‘port 22’
All in all, this is a pretty nice tool to keep an eye on things once in a while or perhaps when someone complains things are a little slow.
iptraf is also a very nice and easy-to-use tool, with a very neat curses GUI. It actually has a lot more features than iptraf—the IP interface monitor shows you TCP and UDP separately, and for TCP it shows you packet flags (making it easy to identify connection attempts that are not succeeding, for instance). Overall statistics for each interface are also available in a separate screen, and on the whole it’s almost a real GUI (using curses), with menus and sub-menus, etc. It also has a very slick filter specification GUI, if you’re not the command line type.
Despite all this, however, I find myself using iftop for day to day use, because iptraf lacks the aggregation, multiple averages, quick and easy filtering, etc, that iftop does. Plus, most of the filters I want are much easier to type into iftop or at the command line.
Some last words
I don’t use these tools every day, but when I needed them, they were really useful. Could I have gotten by without knowing them? Maybe… but that’s not how we think, is it? A workman needs as many tools as he can get his hands on, and these are some of mine.
Among these, iftop remains the one I use more often than the others. It’s actually closer to monitoring than troubleshooting, but they’re all great tools, and exploring them gives you an understanding of what’s happening under the hood as your machine goes about its daily business.


awesome topic … i love it …
awesome topic … i love it … :(
Pretty cool article!!!!!