Any server, system or an application keeps a record of the significant events that happen across its various sub-components. These events are typically recorded with different significance levels (such as error, info, debug, etc). The files in which the events are collected are known as log files, and this logging may be centralised or distributed across the sub-components of the system. The log files are consulted by the operations personnel in the event of an error to identify the root cause of the problem and to fix it. The log entries typically contain information regarding the time of the event, component in which the event occurred and the description of the event.
The need for a log management system
A log management system (LMS) collates, stores, archives and provides utilities for searching log files and alerts administrators in case of critical errors in the system. As the log files tend to accrue and grow in size over a period of time, it is not uncommon to deal with log files of the order of Gigabytes. Extracting useful information from these log files is a complicated task not only due to the size, but also owing to the discrepancies in the format of log files generated by different sub-components of the system. Another complication is to tie up the log entries across multiple but related components that are involved in the root cause of the error. Typically, developers tend to make use of system utilities like awk, tail and cat along with grep/regex to look for clues regarding the errors. This approach is like searching for a needle in a haystack, and hence a more systematic and scalable mechanism is needed to tackle distributed and huge log files
To summarise, the following common problems faced by the operations teams in organisations necessitates the use of an LMS:
- Diverse logging formats employed by different sub-systems. For instance, the timestamp format/time zones used by different sub-systems could be different.
- Distributed systems have different log files, all of which typically need to be digested to analyse errors.
- If the log files are located within the system, then a critical error might cause the loss of log files, and hence an LMS that is physically separate from the system is needed.
The sheer size or the rate at which logs are generated mandates automation of log management, as it is very difficult to analyse rolling logs by human analysts.
There are several open source tools (like Logalyze, Greylog2, Fluentd and Logstash) that can help us in setting up an LMS. In this article, we present the details of an LMS that we have set up in the data centre at Thiagarajar College of Engineering (TCE) Madurai, Tamilnadu, using Logstash, Elasticsearch and Kibana.


The LMS workflow
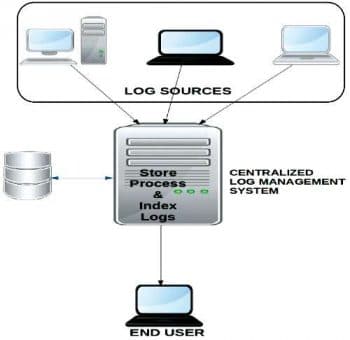
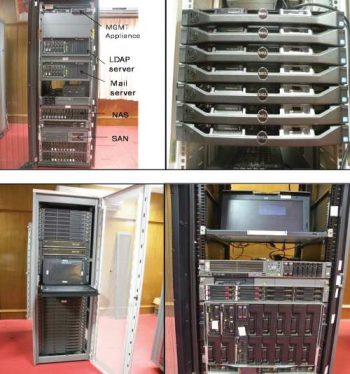
Figure 1 depicts the various components and their interactions in the LMS that we built in TCEs data centre (Figure 2).
Setting up a centralised LMS using Logstash
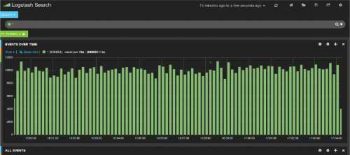
Logstash was developed by Jordan Sissel and in one of the talks at Puppetconf, he remarked that its main objective was simplicity. Based on our experience with Logstash, it truly is extremely simple to use and also scales well with the size of the log files. Kibana is the front-end interface for Logstash that facilitates log visualisation and exploration. Logstash has a back-end to store, track and search for the desired patterns and to analyse log entries. It has a plethora of other options to set up an LMS. It has a graphical search console, which is depicted in Figure 3.

The Logstash pipeline
The Logstash pipeline has three phasesinput, filter and output. A single Logstash instance can receive inputs/events from multiple input sources; filters are set up to collect events of interest and multiple filters can be set up to enhance the precision with which events of interest can be found. The events which pass through these filters can be sent to multiple outputs.
Input: Logstash has a forwarder component, using which log entries can be collated from multiple sources like Stdin, Files, RabbitMQ, Email, Twitter, etc. The Logstash forwarder currently supports over 40 sources. The forwarder streams log entries into Logstash, and adds type and some additional tags like the host name and forwarded timestamp to the entries. The tags help in identifying the source from which the log entry is streamed and cannot be overridden. These tags are attached to the header of the message streamed by the forwarder, and the original log entry from the source is available in the payload of the message packet.
Filter: This is the workhorse of the entire LMS and can be used to apply different filters to parse log entries from different sources. This helps in dealing with the discrepancy in the formats of the log entries from different sources to normalise the log entries streamed into Logstash. The type attribute added by the forwarder in the header can be used to differentiate log entries from various sources, and helps in applying appropriate filters to the log entries.
Grok is used by the Logstash filter for matching patterns of interest with the incoming log entries from the forwarder. Patterns are typically specified using regular expressions (regex) and for intricate patterns, specifying a regex would be tricky; hence, Logstash provides a Regex library that hosts human-readable aliases for commonly used regex patterns. The format for specifying patterns in Grok is %{Syntax specification (or) pattern: Semantic actions}. Standard regex patterns are available as a Logstash plugin.
Output: The output from Logstash can be used for multiple purposes like storing, notifying, relaying to another logging system, collecting metrics and management reporting. The output can be redirected to one of the 50+ destinations supported by Logstash like Elasticsearch, etc.
There are plugins available in Logstash for input, filter and output phases, and a user can write plugins for these phases to be used with Logstash too. In case of failures like the non-availability of a suitable parser script to parse the incoming log entry, non-responsive input/output sources, etc, the pipeline halts. Logstash can be downloaded from https://www.elastic.co/downloads/logstash.
Elasticsearch
Elasticsearch is a search and analytics tool that can be used with Logstash to find patterns of interest in the log entries in real-time (as the logs roll) and hence can provide useful real-time insights. The Elasticsearch tool can be downloaded from https://www.elastic.co/downloads/elasticsearch.
Kibana
Kibana is a tool that helps in visualising log reports as charts, maps, tables, etc. And it also has provisions for performing advanced data analytics and creating customisable dashboards. Kibana can be downloaded from https://www.elastic.co/downloads/kibana.
Some troubleshooting tips
(i) While working with the RADIUS logs, we couldnt find any Grok pattern. So we had to formulate Grok patterns for filtering from a file containing the RADIUS log. When we ran Logstash, it did not receive any data from the file. This was because there were some errors in the Grok pattern. When we corrected these errors and re-ran Logstash, it still did not pull any data from the file. This was because Logstash keeps track of a files last modified timestamp, and it applies the filter only when the last modified timestamp is later than the latest timestamp at which Logstash pulled in the data from the file.
(ii) Files sent by the Logstash forwarder from one system were not received by the Logstash pipeline which was running in another system. We later found that the problem was with the ssh setting. Check your ssh settings and ssh keys before running the Logstash forwarder.
Benefits
After setting up the LMS at the TCE data centre, we realised the following benefits:
- Convenience in managing and archiving logs.
- Reduction in mean time to repair (MTTR) as the root cause for the failures can be quickly analysed.
- Convenience in analysing and searching real-time rolling logs generated by transactional applications running in TCEs data centre.
- Centralised LMS set-up helps researchers and faculty of TCE in archiving log entries and creating a test set for evaluating their data analytic algorithms.
References
[1] Standard Regex patterns- https://github.com/logstash-plugins/logstash-patterns-core/tree/master/patterns [Accessed on 11-June-2015]
[2] Input Plugins – https://www.elastic.co/guide/en/logstash/current/input-plugins.html [Accessed on 11-June-2015]
[3] Filter Plugins – https://www.elastic.co/guide/en/logstash/current/filter-plugins.html [Accessed on 11-June-2015]
[4] Output Plugins – https://www.elastic.co/guide/en/logstash/current/output-plugins.html [Accessed on 11-June-2015]
[5] User defined Plugins – https://www.elastic.co/guide/en/logstash/current/contributing-to-logstash.html [Accessed on 11-June-2015]
[6] Logstash Download Link – https://www.elastic.co/downloads/logstash [Accessed on 11-June-2015]
[7] Download Link for Elasticsearch – https://www.elastic.co/downloads/elasticsearch [Accessed on 11-June-2015]
[8] Download Link for Kibana – https://www.elastic.co/downloads/kibana [Accessed on 11-June-2015]
[9] RADIUS Server http://en.wikipedia.org/wiki/RADIUS [Accessed on 11-June-2015]


