Observium is a network monitoring platform that supports a wide range of operating systems such as Windows, Cisco, Juniper, Dell, HP and Linux. It is open source and free, and based on PHP/MySQL. It collects data from devices by using the Simple Network Management Protocol (SNMP) and displays it through graphical presentation via a Web interface. It makes use of the RRDtool package, and requires no manual interpretation or very little of it. It can be integrated with some other open source tools for network monitoring such as Cacti or Nagios. Observium uses the GeSHi and jpgraph software packages to extend its features.
The platform supports IPv6 address tracking, VLAN tracking, VRF and pseudowire tracking, device inventory tracking, session tracking and so on. It also supports auto discovery of the network infrastructure, and finds the network section that needs to be monitored.
Installation of Observium on CentOS
The following steps will help you install Observium on the CentOS, x86_64 platform.
1. Install the RPM Forge and EPEL repositories as follows:
rpm --import http://apt.sw.be/RPM-GPG-KEY.dag.txtrpm -Uvh http://packages.sw.be/rpmforge-release/rpmforge-release-0.5.2-2.el6.rf.x86_64.rpmrpm -Uvh http://download.fedoraproject.org/pub/epel/6/i386/epel-release-6-8.noarch.rpm |
2. Install the required packages for Observium as follows:
yum install wget.x86_64 httpd.x86_64 php.x86_64 php-mysql.x86_64 php-gd.x86_64 php-posix.x86_64 php-mcrypt.x86_64 php-pear.noarch \vixie-cron.x86_64 net-snmp.x86_64 net-snmp-utils.x86_64 fping.x86_64 mysql-server.x86_64 mysql.x86_64 MySQL-python.x86_64 \rrdtool.x86_64 subversion.x86_64 jwhois.x86_64 ipmitool.x86_64 graphviz.x86_64 ImageMagick.x86_64 |
3. Download the latest .tar.gz of Observium and uncompress it as follows:
wget http://www.observium.org/observium-community-latest.tar.gztar zxvf observium-community-latest.tar.gz<a href="https://www.opensourceforu.com/?attachment_id=16185" rel="attachment wp-att-16185"><img class="alignnone wp-image-16185" src="https://www.opensourceforu.com/wp-content/uploads/2015/06/Table-2-350x183.jpg" alt="Table 2" width="381" height="199" /></a><a href="https://www.opensourceforu.com/?attachment_id=16186" rel="attachment wp-att-16186"><img class="alignnone wp-image-16186" src="https://www.opensourceforu.com/wp-content/uploads/2015/06/Table-3-350x89.jpg" alt="Table 3" width="378" height="96" /></a> |
4. Install the MySQL database and configure a root password to MySQLd, as follows:
service mysqld start /usr/bin/mysqladmin -u root password yournrewrootpasswordmysql -u root -pCREATE DATABASE observium DEFAULT CHARACTER SET utf8 COLLATE utf8_general_ci;GRANT ALL PRIVILEGES ON observium.* TO observium@localhost IDENTIFIED BY <observium db password>; |
5. Configure Observium based on steps available in http://www.observium.org/wiki/RHEL_Installation
6. Visit http://<server ip>
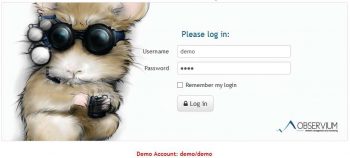
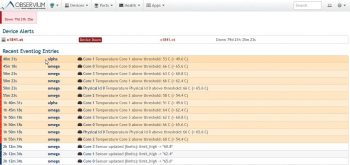
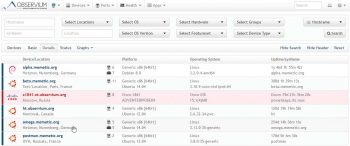
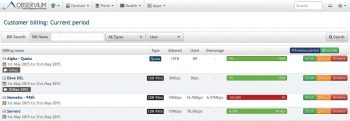
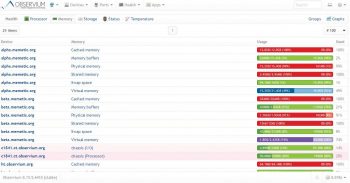
There is a live demo of Observium at http://demo.observium.org/. Log in with a demo account: demo/demo. Some screenshots from the live demo are given in this article (Figure 1).
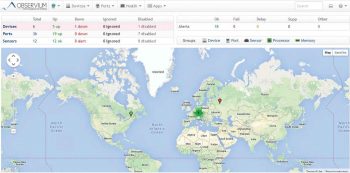
The dashboard provides information on devices, ports, sensors and alerts (Figure 2).
The Device Alerts section provides related information and recent event log entries too (Figure 3).
Go to the Devices menu and click on All devices, which will provide you information on devices, the platform, operating system, etc (Figure 4).
Go to the Ports menu and click on Traffic Accounting. It will give information related to Customer billing (Figure 5).
Go to the Health menu and click on Memory to get information regarding devices, memory, usage, etc (Figure 6).
To get polling information and discovery timing, go to the main menu and select Polling Information (Figure 7).

Features of Observium
- Auto-discovery of SNMP based network monitoring tool
- Application monitoring, using SNMP
- Includes support for network hardware and operating systems such as Cisco, Juniper, Linux, FreeBSD, Foundry, etc.
- Metrics supported: CPU, memory, storage, IPv4, IPv6, TCP and UDP stack statistics, MAC/IP, users, processes, load average, amperage, power, humidity, temperature, fan speed, voltage, uptime statistics, device inventory collection and Linux distribution detection
- Host monitoring well supported using check_mk and support scripts
- Billing module
- Integration with Smokeping, collectd, Syslog, etc.
Due to these powerful features, system admins can totally depend on Observium to monitor their network 24×7.
References
[1] http://www.observium.org
[2] http://en.wikipedia.org/wiki/Observium
[3] http://en.wikipedia.org/wiki/Comparison_of_network_monitoring_systems
[4] http://www.observium.org/wiki/Users


