This article explains how to set up ftrace and be able to understand how to trace functions. It should be useful for current kernel developers and device driver developers who want to debug kernel issues, and also for students who are keen to pursue a Linux systems programming career.
ftrace (Function Tracer) is the “Swiss army knife” of kernel tracing. It is a tracing mechanism built right into the Linux kernel. It has the capability to see exactly what is happening in the kernel, and debug it. ftrace is more than a mere function tracer, and has a wide variety of tracing abilities to debug and analyse a number of issues like latency, unexpected code paths, performance issues, etc. It can also be used as a good learning tool.
ftrace was introduced in kernel 2.6.27 by Steven Rostedy and Ingo Molnar. It comes with its own ring buffer for storing trace data, and uses the GCC profiling mechanism.
Prerequisites
You need a 32-bit or 64-bit Linux machine with a kernel development environment, and as new a kernel as possible (the newer the kernel, the more the tracing options you get). I use a Fedora Core 13 (x86_64) machine in my environment, but any distribution would suffice.
Setting up Ftrace
debugfs needs to be set up to run on the machine you want to use ftrace on. If you are unaware of how to set up debugfs, do refer to my debugfs article from last month.
debugfs should have been mounted on /sys/kernel/debugfs, and if tracing is enabled, you should be able to see a directory called tracing under debugfs. If debugfs is not mounted, you can issue the following command:
# mount -t debugfs nodev /sys/kernel/debug |
If you are unable to see the tracing subdirectory, you will need to enable tracing in the kernel configuration, and recompile it. Look for the following options to be enabled in the kernel configuration path (refer to Figure 1):
Kernel Hacking -> Tracers
- Kernel Function Tracer (
FUNCTION_TRACER) - Kernel Function Graph Tracer (
FUNCTION_GRAPH_TRACER) - Enable/disable ftrace dynamically (
DYNAMIC_FTRACE) - Trace max stack (
STACK_TRACER)

Depending on your architecture, a few more tracers can be enabled during compilation, as per requirements. The listed tracers are for debugging. Once the kernel compilation is complete, and you have booted to the new kernel, tracing can be initiated.
Tracing
Files in the tracing directory (/sys/kernel/debug/tracing) control the tracing ability (refer to Figure 2 for a list of files). A few files could be different, depending upon what tracers you selected during kernel configuration. You can obtain information on these files from the <kernel source>/Documentation/tracing directory.

Let’s explore a few of the important ones:
available_tracers: This shows what tracers are compiled to trace the system.current_tracer: Displays what tracer is currently enabled. Can be changed by echoing a new tracer into it.tracing_enabled: Lets you enable or disable the current tracing.trace: Actual trace output.set_ftrace_pid: Sets the PID of the process for which trace needs to be performed.
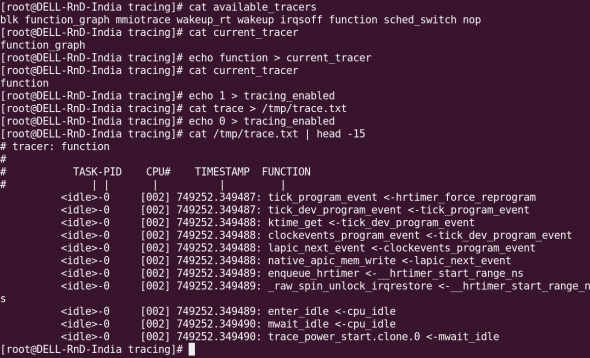
To find out the available tracers, just cat the available_tracers file. Tracers in the space-separated output include: nop (not a tracer, this is set by default); function (function tracer); function_graph (function graph tracer), etc:
# cat available_tracersblk function_graph mmiotrace wakeup_rt wakeup irqsoff function sched_switch nop |
Once you identify the tracer that you want to use, enable it (ftrace takes only one tracer at a time):
# cat current_tracer ##to see what tracer is currently in use.# echo function > current_tracer ##select a particular tracer.# cat current_tracer ##check whether we got what we wanted. |
To start tracing, use the following commands:
# echo 1 > tracing_enabled ##initiate tracing# cat trace > /tmp/trace.txt ##save the contents of the trace to a temporary file.# echo 0 > tracing_enabled ##disable tracing# cat /tmp/trace.txt ##to see the output of the trace file. |
The trace output is now in the trace.txt file. A sample output of a function trace obtained with the above commands is shown in Figure 3.

To be continued
We will explore more ftrace options, and consider some tracing scenarios next month.
References
Linux kernel’s Documentation/tracing directory has been referred to. Apart from that, a few articles from LWN were referred to, as well. Readers can find abundant information in these resources for additional information.


[…] 1, 2010 in Developers, How-Tos, Tools / Apps · No CommentsIn my previous article, we had a working setup of ftrace, and explored options to enable and disable it. In this article, we will explore a few more capabilities of ftrace.Let’s begin with tracer […]
[…] gives a quick overview of code flow, but gives a lot of information. Tools like strace, ltrace and ftrace are used for tracing.Profiling: Does sampling while running, and we can do the analysis after the […]
Very well written guide.
I did unfortunately hit a wall. Would you help further?
$ sudo ls -l > /sys/kernel/debug/tracing/tracing_on
bash: /sys/kernel/debug/tracing/tracing_on: Permission denied
Also:
$ sudo cd /sys/kernel/debug/tracing/
sudo: cd: command not found
Forgot to include this! – the command you instructed to use and which, I am sorry to say, has not worked:
$ sudo echo 1 > /sys/kernel/debug/tracing/tracing_on
bash: /sys/kernel/debug/tracing/tracing_on: Permission denied
Have sought help also for this problem, here: http://ubuntuforums.org/showthread.php?t=2151624