 In the first part of this series, I gave a brief introduction to Open Flash Charts (OFC) and discussed how to draw bar charts with it. In this article, I will explain how to draw a pie chart. Since we have already discussed the prerequisites of OFC and how to set it up in the previous article, let us go straight to drawing the chart.
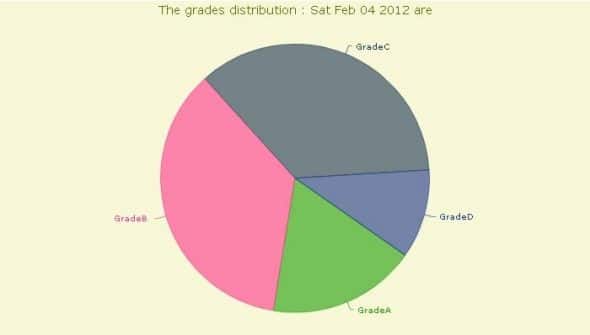
First, we need to define the values to be plotted on the pie chart. For our sample chart, let’s look at the example of a classroom. Our pie chart will show the distribution of the number of students getting different grades in a class of 28. Our data is shown in the following table:
| Grade | No. of students |
| A (More than 80 marks) | 5 |
| B (60-80 marks) | 10 |
| C (40-60 marks) | 10 |
| D (0-40 marks) | 3 |
Now let us draw a pie chart showing the marks’ distribution. Let’s first store the above data to a database (I assume MySQL). Once that’s done, let’s create the data file, with the SQL query that fetches the data to be plotted. The data is then properly formatted and passed on to the interfaces provided by OFC, which then renders the graph to the Web page.
There are several functions available, depending on the type of graph to be plotted; so select the function according to your need, and pass it the data. The data file for our example pie chart is as follows:
<?php
$die = false;
$link = @mysql_connect('localhost','test_user', 'test_pwd') or ($die = true);
if($die)
{
    echo '<h3>Database connection error!!!</h3>';
    echo 'A connection to the Database could not be established.<br />';
    echo 'Please check your username, password, database name and host.<br />';
    echo 'Also make sure <i>mysql.class.php</i> is rightly configured!<br /><br />';
}
mysql_select_db('test_database');
include_once 'php-ofc-library/open-flash-chart.php';
$query = mysql_query('SELECT DISTINCT Grade, Number FROM test_piechart');
While($queryRow = mysql_fetch_array($query, MYSQL_ASSOC))
{
    $label[] = $queryRow['Grade'];
    $dataForGraph[] = intval($queryRow['Number']);
}
$title = new title( 'The grades distribution : '.date("D M d Y").' are' );
$title->set_style( '{color: #567300; font-size: 14px}' );
$chart = new open_flash_chart();
$chart->set_title( $title );

$pie = new pie();
$pie->set_alpha(0.6);
$pie->set_start_angle( 35 );
$pie->add_animation( new pie_fade() );
$pie->set_tooltip( '#val# of #total#<br>#percent# of total strength' );
$pie->set_colours( array('#1C9E05','#FF368D','#1A3453','#1A3789') );
$pie->set_values( array(new pie_value($dataForGraph[0], "Grade" . $label[0]),
                new pie_value($dataForGraph[1], "Grade" . $label[1]),
                new pie_value($dataForGraph[2], "Grade" . $label[2]),
            new pie_value($dataForGraph[3], "Grade" . $label[3])) );

$chart->add_element( $pie );
echo $chart->toPrettyString();
?>
Here, let’s first connect to MySQL, then select the database (customise it to your settings). Let’s include the OFC library file, to make the APIs available. The database query returns the data, which is then saved to the arrays.
Now let’s start using OFC. First, create the graph title object, and use set_style to set its colour and font. Then create a new chart object and pass it the title using set_title. Next, create the pie object, using set_alpha, set_start_angle, and add_animation methods to give additional effects to the pie chart.
The set_tooltip method adds tool-tips to the pie, displaying information about the pie when the mouse-over is done. The argument passed to this method displays the value of a slice, and the total sum of values. The second line shows the percentage. In the set_colours method, the colours are passed as an array for different pie slices. The last method used for the pie object is set_values, where the value of the pie slices and the label, are passed as a pair. Finally, the pie object is added to the chart using add_element. The last line is used to format the data properly, so that the HTML file can use the data.
Save this file as data_file.php in the Web server root folder. Next, given below is the HTML file to be used:
<html>
<head>
    <title></title>
<script type="text/javascript" src="js/swfobject.js"></script>
<script type="text/javascript">

swfobject.embedSWF(
  "open-flash-chart.swf", "pie_chart",
  "700", "400", "9.0.0", "expressInstall.swf",
  {"data-file":" data_file.php "} );
</script>
</head>
<body>
 <div id="pie_chart">
</div>
</body>
</html>
Here, I have invoked the data file I just saved as data_file.php. The size of the graph to be plotted can be passed as arguments; here, it is 700 and 400 pixels. The rest of the HTML file is just the addition of <div id="pie_chart">, created in the header, where I gave the name pie_chart while embedding the Flash.
Ensure the div ID is the same as the name given while embedding the Flash object. Save this file as Pie_display.html in the Web server root folder. When accessed through the browser, you can see the graph in action, as in Figure 1.

Hope you liked the article, and that it was useful. Any queries or suggestions are most welcome. In the next article in this series, we will look at how to create other innovative charts.
Links & references
- See the above code in action here
- OFC official website
- Reference of pie charts methods


big like ;
Thanks for the info. But, will Google chart be another option?
do you have the files to download? please send me to my email luis_589@outlook.com the 3 examples thank u for your help!