QGIS is free and open source software for creating, editing, visualising, analysing and publishing geospatial information. It is OS-independent and works on Linux, Windows, Mac and BSD. An Android version is expected shortly. This tutorial on assigning map projections in QGIS is aimed at beginners.
Have you wondered how projections are assigned to particular data in GIS software? In this article, we will take our first step in exploring how map projections work in QGIS.
QuantumGIS (QGIS) is one of the worlds most popular, free and open source, desktop GIS software used for making maps and in GIS analysis. The version of QGIS used in this tutorial is QGIS 1.8.0.
Map projections determine how the map being displayed is related to real places on the earths surface. It is important that GIS software users assign a projection to the data before carrying out any analysis so that the locations in the data match the location in the real world.
Projection, or map projection, is termed as the Coordinate Reference System (CRS) or Spatial Reference System (SRS) in QGIS.
All coordinate systems used in GIS are classified into two types:
- Geographic coordinate system, and
- Projected coordinate system
A geographic coordinate system is a reference system that uses a three-dimensional spherical surface to determine locations on the earth. Any location on earth can be referenced by a point with longitude and latitude coordinates. The three dimensional surface is usually an ellipsoid. Projected coordinate systems project the ellipsoid to a 2D surface (like a sheet of paper).
QGIS allows users to define the CRS for layers without a pre-defined CRS. It also allows users to define custom coordinate reference systems and supports on-the-fly (OTF) projection of vector and raster layers. All these features allow the user to display layers with different CRS and have them overlay properly.
I have used the Karnataka administrative boundary layer in this tutorial. Whichever layer is used, the procedure will remain the same. What might change is the name of the projection assigned to the layer, which might be a different projection compared to the one used in this tutorial.
Load the layer in QGIS
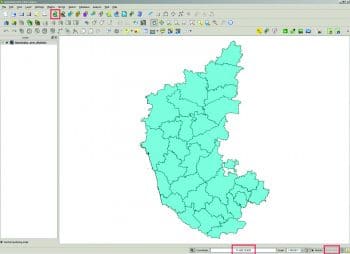
Load the Karnataka boundary layer in QGIS by selecting the load vector layer button as highlighted in Figure 1 (the red square) or on the main menu. Click on Layer > Add vector layer. Notice the label coordinate at the bottom of the QGIS window. As and when the cursor is moved on the map, the label will show you the X and Y coordinates of the exact location of the cursor. Also, at the bottom-right corner of the QGIS window, you can see EPSG: 4326. This is the code (ID) for the CRS that is assigned to the layer.
Determining the projection of a layer if it is already assigned to the layer
To determine the projection of a layer, right click on the layer under the Layers window on the left side of the QGIS window. Next, under the Properties window, click on the Metadata tab. The CRS assigned to the layer can be seen under the label Layer Spatial Reference System. The CRS currently assigned is WGS 84 (red square in Figure 1).
Re-projecting a layer (which already has a projection) to a different projection
A layer for which the projection is already assigned can be changed using the following steps.
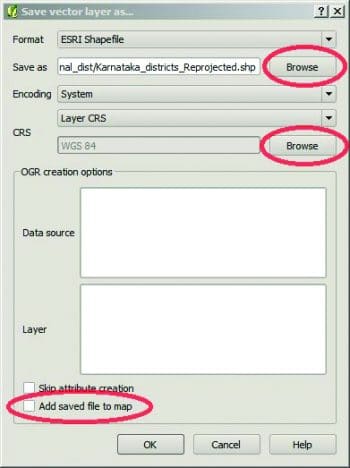
Right-click on the layer and click on Save as. Next, click on the Browse button next to the Save as label, name the output file and save it in an appropriate location.
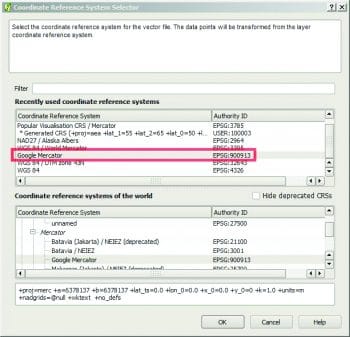
Next, click on the Browse button next to the CRS label; at this stage, it shows the name of the projection that the layer is currently assigned to.
Let us choose Google Mercator (EPSG: 900913), which is the CRS used in Google maps. Click OK. Tick the option Add saved file to map. Again click OK to close the Save vector as... window. The newly created shape file will be automatically added to the QGIS window.
Projection transformation (on-the-fly projection)
Once the newly created layer is loaded in QGIS, you can observe that even though the table of contents lists the layer (on the left), the layer is not visible in the map drawing window. This is because the previous layer has a latitude/longitude coordinate system and the newly created layer has a different coordinate system. So the re-projected layer will be located somewhere outside the current view. To view this layer, right click the layer and click on Zoom to layer extent.
Now the newly created layer can be seen but not the previous one. This error is common while working with layers in different projections.
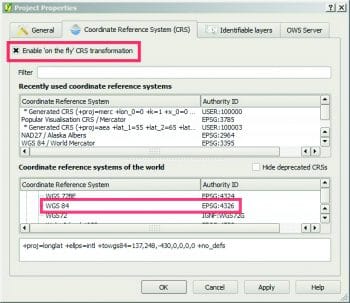
Ideally, it would be preferable to view the layers on top of each other even if they are assigned different map projections. The option used for this is the on-the-fly projection. To enable this option, follow these steps. First, click on Settings > Project properties. Then, click on the box labelled as Enable on the fly CRS transformation. Next, select the projection which the current layer and all the subsequent layers will be using in common. Let us choose WGS 84. Click OK.
You can immediately see the resultboth the layers are overlaid on top of each other in the same view. In case you cant see the result immediately, then right click on one of the layers in the table of contents, and select Zoom to layer extent.
Assigning a projection to a raster layer that has no projection defined
For this, I used the freely available Miniscale raster layer data for the UK. This layer was downloaded from the UKs OS open data initiative (https://www.ordnancesurvey.co.uk/opendatadownload/products.html).
We will also be using the freely available vector data downloaded from Natural Earth (http://www.naturalearthdata.com/), particularly the ne_10m_admin_0_countries layer.
After downloading the data, the Zip file is extracted. The folder we used was the RGB_TIF_COMPRESSED folder. This folder contains the Tiff files (the plain Tiff files, not the Geotiff files), which means that it has no projection assigned to it. The projection information is usually stored in the .prj file format.
Also, under the RGB_TIF_COMPRESSED/Data folder, we can see a folder named world files. Typically, to open a GIS file in GIS software, we need two types of information, which are:
- The extent of the image
- The projection file (.prj)
The world file is a standard file format introduced by ESRI. This file stores the information on the extent of the raster image. A .prj file stores the projection information of the layer. GIS software can render a GIS file properly if these two files are stored in the same directory as the image file and also have the same file name as the image file.
Click on Layer Menu > Add raster layer. Select MiniScale_(standard)_R15.tif file and click on Open. Select the CRS for the layer. The documentation for the raster layer can be downloaded from the link http://www.ordnancesurvey.co.uk/oswebsite/docs/user-guides/os-opendata-getting-started-guides.pdf . After going through the documentation, it can be determined that the layer is geo-referenced in the British national grid projection. Select it from the list and click OK.
After the layer is loaded, right-click on the layer and select Zoom to extent.
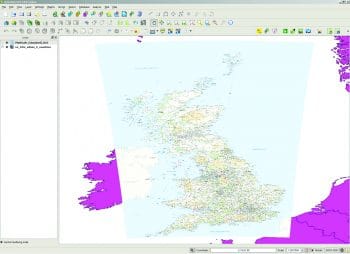
Once zoomed in to the layer, we can see that the newly added raster layer is overlaid perfectly on top of the vector layer. This is how a projection is assigned to a new layer.

