


A Toeplitz network refers to a graph that has a comparable regularity in its structure. SageMath is an excellent tool for facilitating the creation, analysis, and visualisation of graphs. Hence, SageMath can be used to effectively model Toeplitz networks and get insights into their structural characteristics, leading to advancements in network design and analysis.
Toeplitz networks are a category of graphs characterised by an adjacency matrix with a consistent diagonal arrangement. In essence, each row of the matrix is a shifted variant of the preceding row. These networks are commonly utilised in various fields, including signal processing and communication systems, where the interconnections among components display a systematic and repetitive structure.
In graph theory, domination refers to a set of vertices in a graph where every other vertex is either part of this set or is connected to at least one vertex within it. This concept is important because it helps identify key nodes that influence the network, making it a useful tool for optimisation problems, network design, and understanding the structural dynamics of systems.
Analysing domination in Toeplitz networks is essential because of their widespread application in modelling systems with repetitive patterns. Understanding the dominating sets in these networks can improve signal transmission efficiency, refine communication protocols, and help create robust systems. Additionally, this research area is important in various domains, including social network analysis, power grid optimisation, and sensor networks.
To effectively model and analyse these concepts, SageMath serves as an exceptional tool. It offers a comprehensive environment for engaging with graph theory, featuring functions specifically designed for modelling Toeplitz networks and algorithms for investigating domination. With SageMath, researchers and practitioners can simulate, analyse, and visualise intricate network behaviours, making it an invaluable resource for exploring these subjects.
Understanding the Toeplitz network
A Toeplitz network draws its inspiration from the mathematical idea of a Toeplitz matrix, characterised by having constant values along each descending diagonal from left to right. In graph theory, a Toeplitz network describes a graph that displays a comparable regularity in its structure, where the connections (edges) adhere to a repeating or periodic arrangement across its rows or columns.
A Toeplitz matrix is a special type of matrix in which all the elements along any diagonal, extending from the top-left to the bottom-right, are identical. For example, consider the matrix:
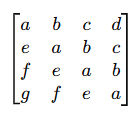
In this matrix, every diagonal is filled with a consistent value — the first diagonal holds the value a, the second holds b, and so on. This property is known as diagonal uniformity. A notable aspect of a Toeplitz matrix is its straightforwardness and consistency—knowing the first row and the first column allows for the complete determination of the entire matrix. This repetitive and organised structure forms the basis for the investigation of Toeplitz networks in graph theory, where similar patterns of repetition and uniformity are explored.
Toeplitz networks possess several important graph-theoretical characteristics that make them valuable for both theoretical exploration and practical implementation. A primary characteristic is domination, which allows for the selection of a subset of vertices such that every vertex in the network is either included in this subset or is adjacent to a vertex within it. The inherent structured repetition found in Toeplitz networks facilitates the efficient analysis and reduction of dominating sets. Additionally, connectivity is notably predictable due to the network’s uniform structure, which aids in examining paths, flows, and the overall resilience of the network. In certain instances, Toeplitz networks may also demonstrate planarity, enabling their representation on a plane without edge crossings, thereby enhancing visualisation and streamlining specific computational processes. These properties, combined with the symmetry and regularity of the network, make Toeplitz networks ideal for modelling and optimising systems with periodic or repeating interactions. Understanding these networks not only deepens mathematical insight but also supports practical advancements in designing robust and efficient systems.
Introducing SageMath
SageMath is an extensive, open source mathematical software platform that offers robust capabilities for conducting a diverse range of computations in fields such as algebra, calculus, number theory, and graph theory. With a focus on accessibility and flexibility, SageMath combines various mathematical libraries and tools, including NumPy, SciPy, Matplotlib, and dedicated graph theory packages, to create a cohesive environment for both symbolic and numerical analysis. Its interface, built on Python, facilitates user engagement by enabling script writing, algorithm development, and the automation of intricate tasks.
SageMath facilitates the straightforward creation, analysis, and visualisation of graphs. When examining structures such as Toeplitz networks, it offers tools for constructing graphs with designated patterns, calculating properties like domination numbers and connectivity, and visualising these networks to uncover structural insights. Its capacity for managing large-scale computations positions it as an excellent option for addressing intricate problems in both theoretical research and practical applications. Furthermore, the open source nature of SageMath promotes customisation and collaboration, making it an invaluable asset for educators, researchers, and students alike. By effectively linking theoretical enquiry with computational prowess, SageMath enables users to investigate and innovate across a diverse array of mathematical challenges.
Modelling a Toeplitz network using SageMath
SageMath’s flexibility and user-friendly interface position it as the perfect resource for exploring Toeplitz networks. By enabling the integration of graph creation, property evaluation, and visualisation within one platform, it minimises the need to transition between different tools, thereby boosting efficiency. Furthermore, its Python-based syntax makes it approachable for those with programming experience, and its open source nature fosters collaboration and customisation to meet specific research requirements. You can use the following code to model a Toeplitz network using SageMath.
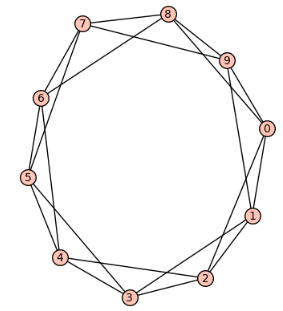
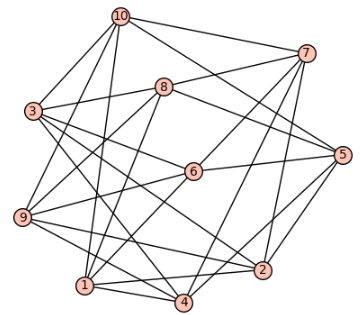
# Importing the graph module

from sage.graphs.graph import Graph

# Define the number of vertices

n = 10

# Create an empty graph

G = Graph()

# Add vertices and edges with periodic connections

for i in range(n):

G.add_vertex(i)

G.add_edge(i, (i + 1) % n) # Connect to the next vertex (wrap-around)

G.add_edge(i, (i + 2) % n) # Connect to the second next vertex (wrap-around)

# Visualize the graph

G.show()
The output is shown in Figure 1.
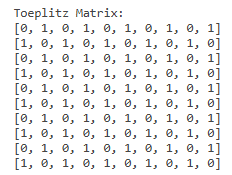
#Creating and visualizing a graph in SAGE

G = Graph([(1, 2), (2, 3), (3, 1)]) # Triangle graph

G.show() # Visualize the graph

#Analyzing the graph

print(“Vertices:”, G.vertices()) # List of vertices

print(“Edges:”, G.edges()) # List of edges

print(“Is the graph connected?”, G.is_connected())

print(“Degree of vertex 1:”, G.degree(1))


from sage.graphs.graph import Graph

# Example Toeplitz matrix

row = [0,1,0,1,0,1,0,1,0,1]

column = [0,1,0,1,0,1,0,1,0,1]

# Get the number of vertices from the size of the matrix

num_vertices = len(row)

# Create a graph from the Toeplitz matrix with nodes labeled from 1 to num_vertices

edges = [(i + 1, j + 1) for i in range(num_vertices) for j in range(i + 1, num_vertices) if column[j - i] != 0]

graph = Graph(edges)

# Print the Toeplitz matrix

toeplitz_matrix = [[column[j - i] for j in range(num_vertices)] for i in range(num_vertices)]

print(“Toeplitz Matrix:”)

for row in toeplitz_matrix:

print(row)

# Draw the graph

graph.show()

# Find the domination set and its size

domination_set = graph.dominating_set()

domination_size = len(domination_set)

print(“\nDomination Set:”, domination_set)

print(“Domination Number:”, domination_size)
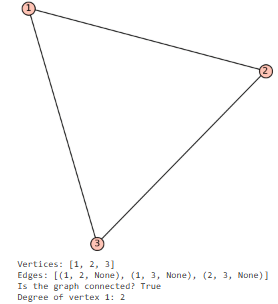
The output is:
![]()
Applications and insights
Toeplitz networks offer a wide range of practical applications due to their organised structure and computational efficiency. In the realm of communication networks, they are instrumental in modelling signal processing systems where periodicity and symmetry play crucial roles, facilitating effective resource allocation and data transmission. In optimisation scenarios, Toeplitz graphs assist in minimising costs while ensuring comprehensive coverage of network nodes, applicable in contexts such as sensor placement and power grid management. Furthermore, their translational invariance proves beneficial for addressing challenges in image processing, DNA sequencing, and time-series analysis. Utilising SageMath, researchers and professionals can effectively model these networks, compute dominating sets, and derive significant insights into their structural characteristics, paving the way for advancements in network design and analysis.
Toeplitz networks help converge mathematical theory and practical applications, delivering sophisticated solutions for challenges in areas such as communication, optimisation, and data analysis. Investigating domination within these networks yields valuable insights into their architecture and functionality, especially in terms of resource optimisation and improving network performance. SageMath stands out as an effective instrument, allowing researchers to effortlessly model, analyse, and visualise Toeplitz networks. By connecting theoretical concepts with practical implementation, SageMath enables users to fully harness the capabilities of graph theory, promoting innovation and enhancing our comprehension of structured networks.


