


Wireshark is an open source tool that helps us analyse and get a deeper understanding of the traffic in our network. Let’s explore how it can help us protect our data.
Cyberattacks have become common today and even the largest corporates are falling prey to them. Data is one of the most valuable assets any company or business owns and the threat to it is only going to increase in the future. Companies are investing a lot into their cybersecurity and networking teams and into research to prevent these cyberattacks. One way to do so is by analysing the network traffic.
Wireshark is a free and open source tool that is majorly used for network traffic troubleshooting and analysis. It can capture packets and give detailed insights into the communication between devices. Wireshark can help us analyse protocols like HTTP, TCP and DNS, and detect vulnerabilities and anomalies.
By analysing network packets using Wireshark, we can detect malicious activities such as intrusion and malware detection. Network packet analysis can help us troubleshoot network issues and the logs can be used to reconstruct events that led to a security incident. This tool can also be used for penetration testing to identify the weak points in a network.
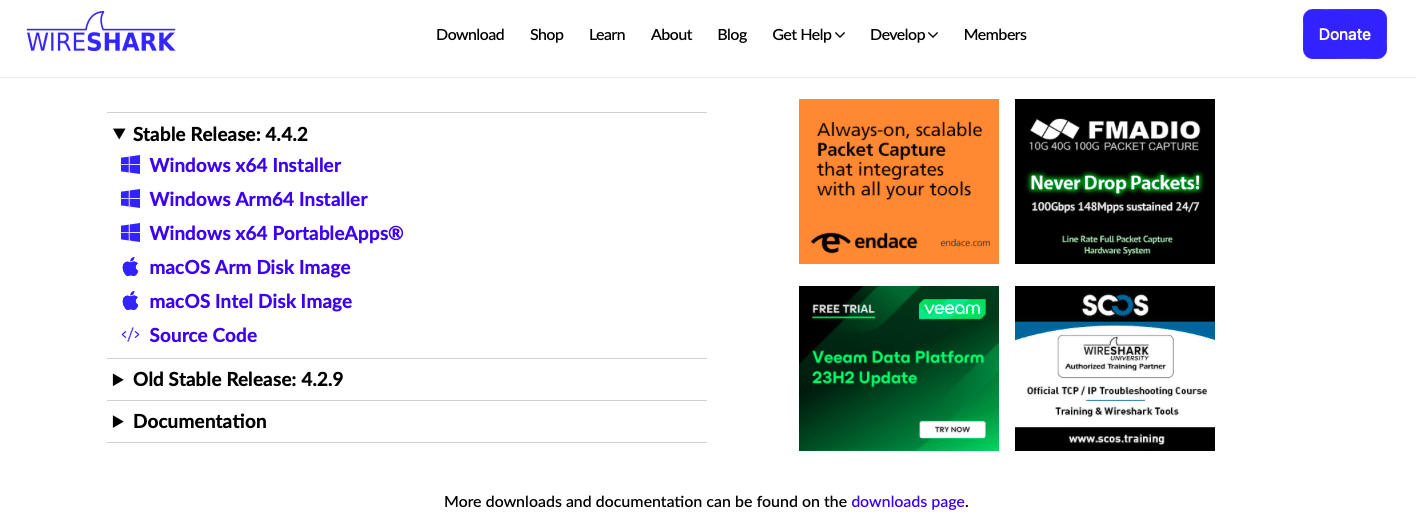
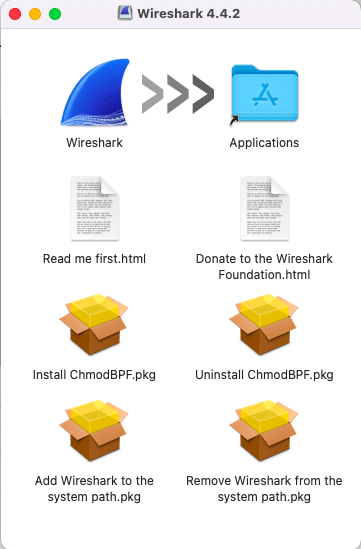
Let us start by installing this application. You can do this by going to https://www.wireshark.org/ and downloading the installer for your operating system as shown in Figure 1. If you are using a Mac system, you can follow Figure 2, where you can drag and drop the .dmg file into your applications.
Once the installation is done, the UI should look as shown in Figure 3. It is here that all the magic happens. You can explore all the different options that Wireshark has for your use case.
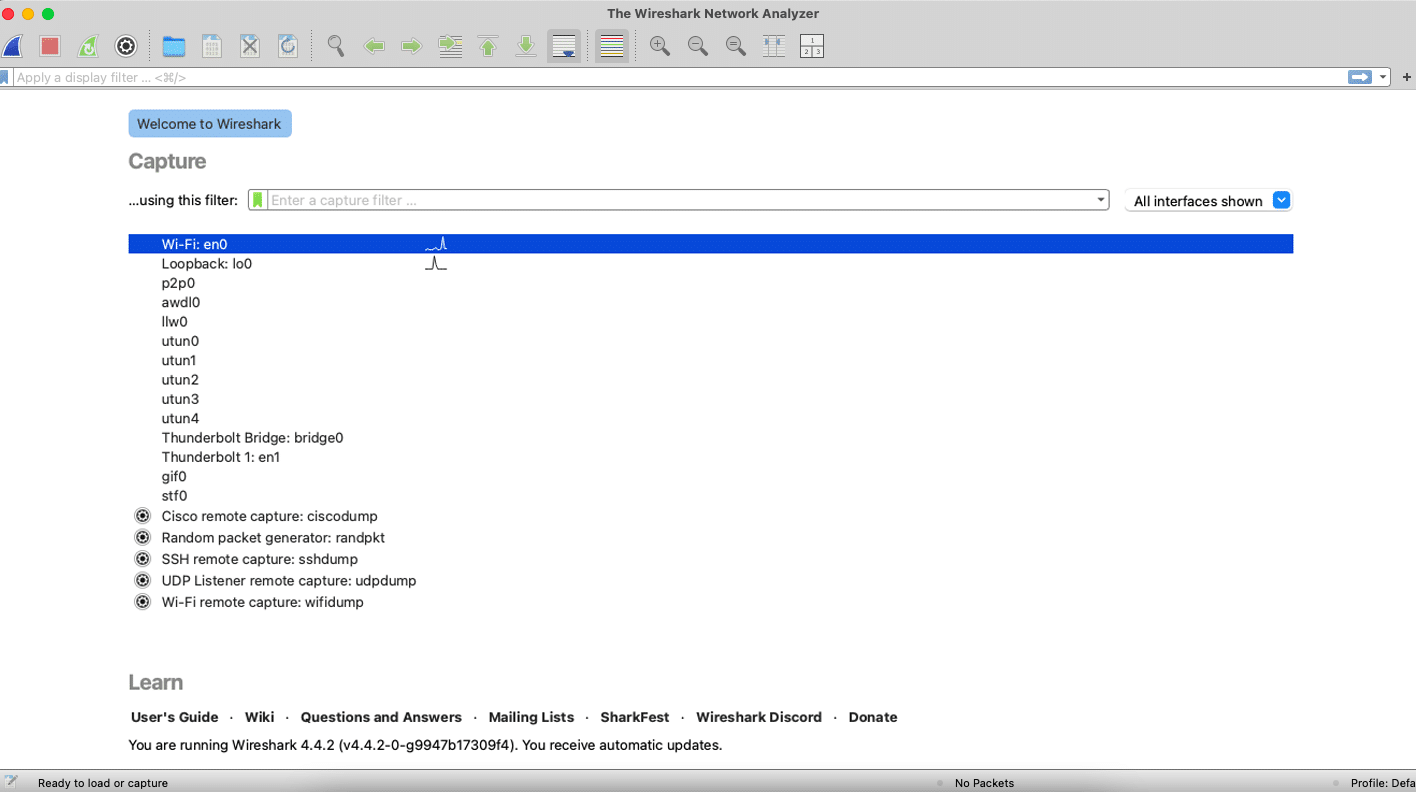
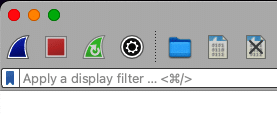
As stated earlier, in Wireshark, we analyse network packets. A packet is a small unit of data that goes from the source to the destination. If you look at the top left corner of this UI, you will find the Start and Stop buttons. The Wireshark logo button is the Start button and the red square is the Stop button, as shown in Figure 4.
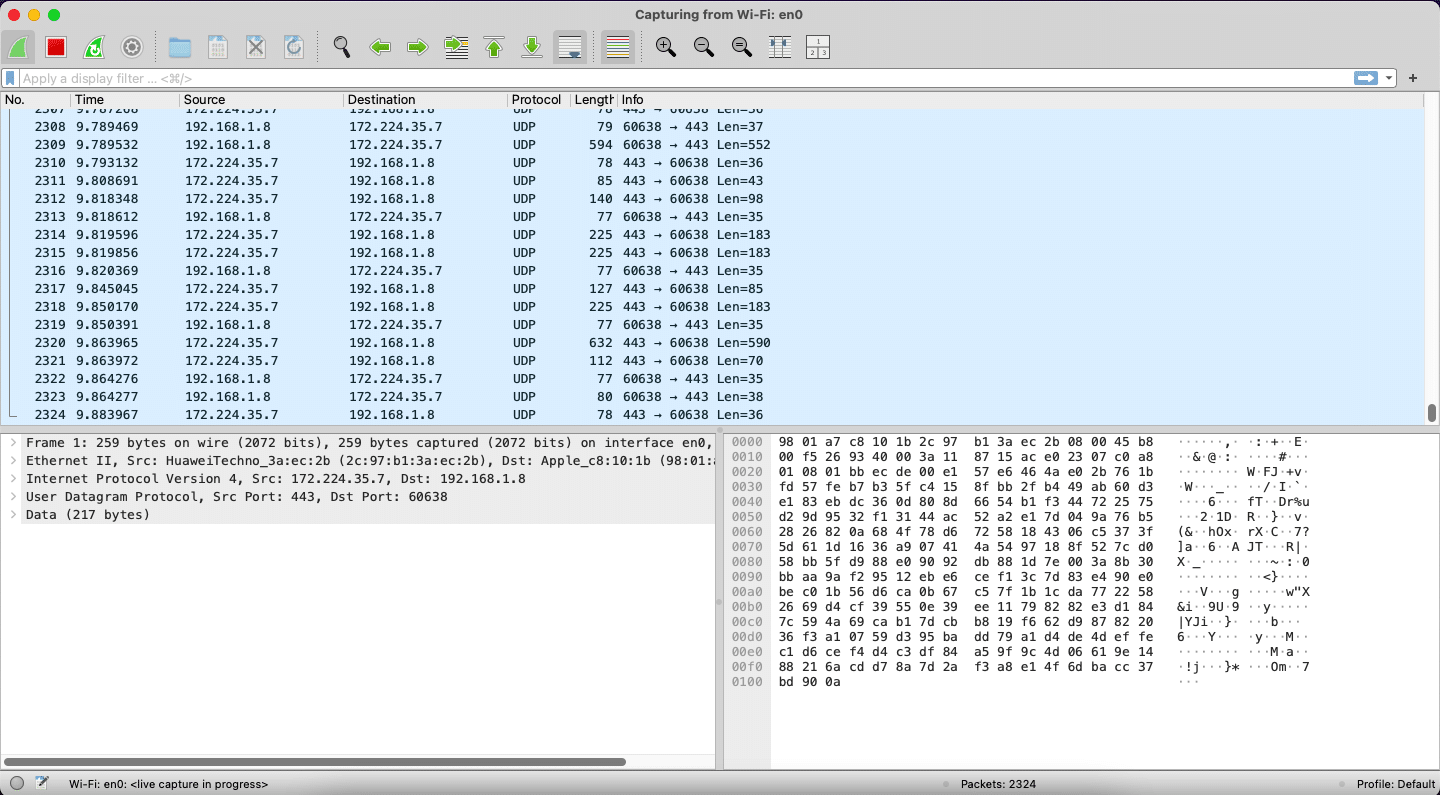
You can see that you have different options to choose from to analyse the packets — you can choose Wi-Fi or Ethernet if you are connected to one. Once that is done, you can click the Start button, and you will see all the packets of data coming to and going from your machine as shown in Figure 5.
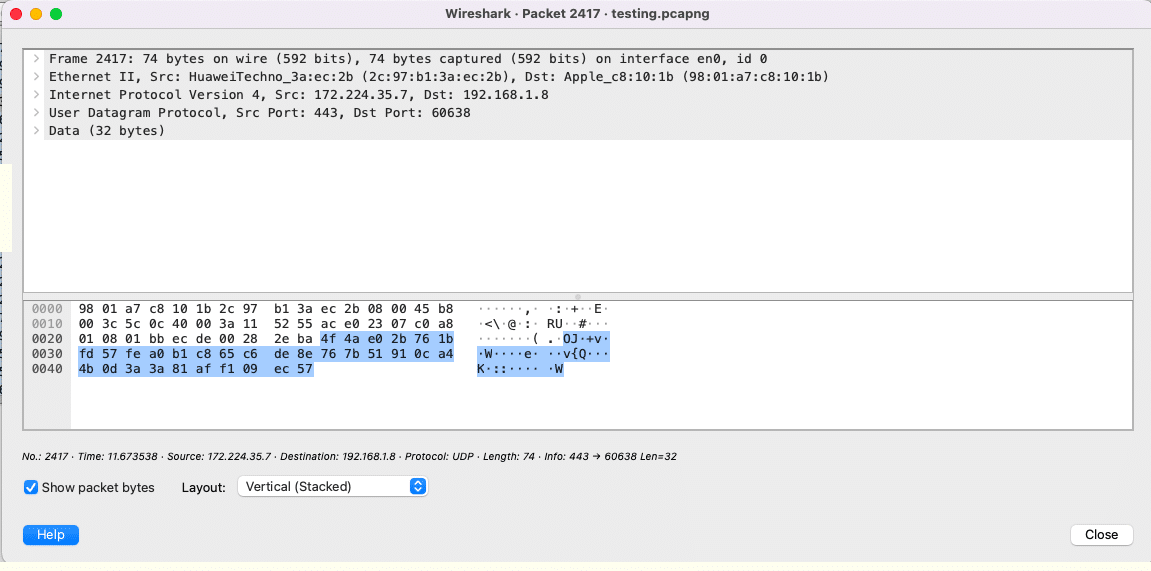
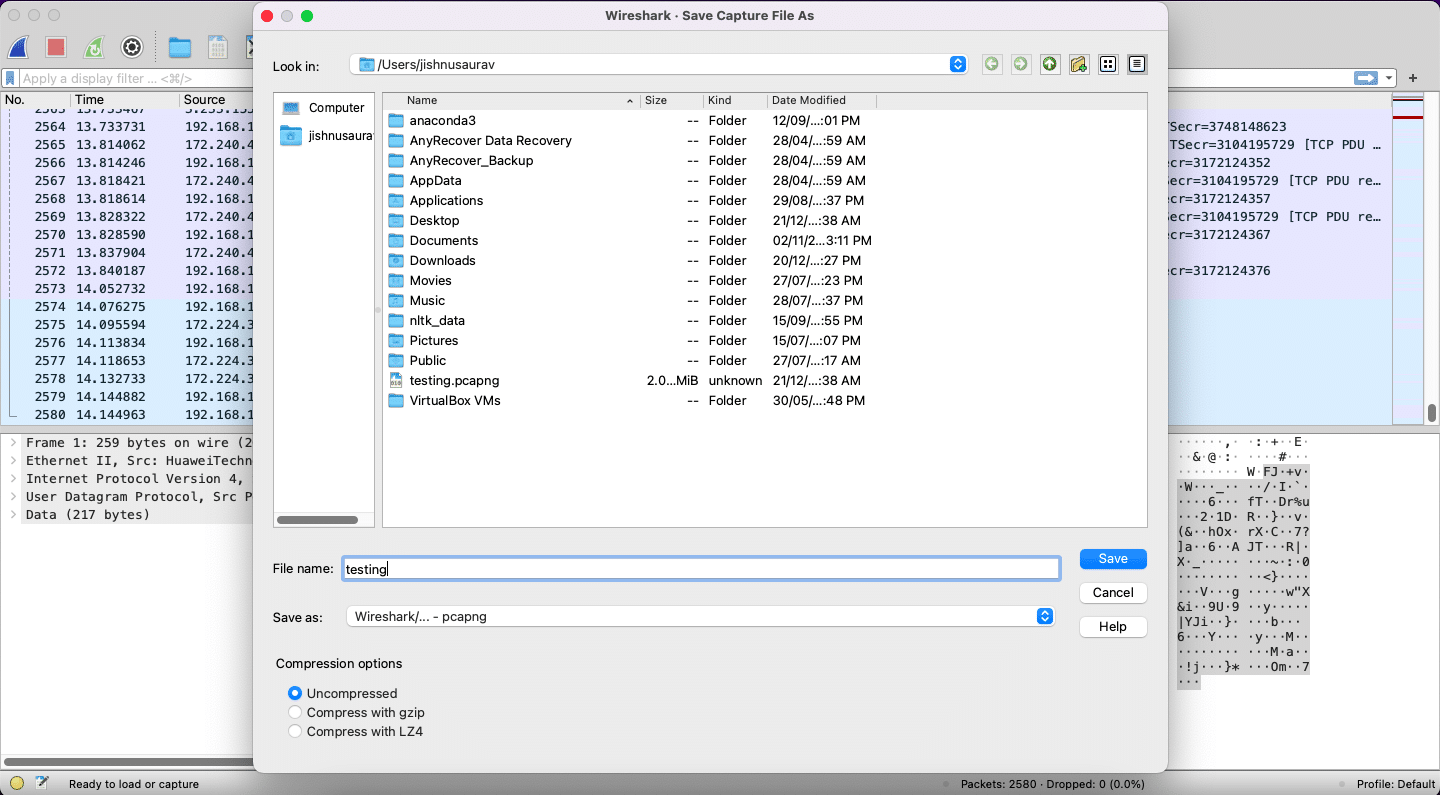
Now click the Stop button and see how many packets were sent in this duration. After this, you can click on each packet and analyse what the packet is, what protocol it has, and more as shown in Figure 6. In my case you can see that it is a packet using UDP protocol. You can also see the source destination and the other details as needed. You can save this capture for further analysis later as a .pcapng file as shown in Figure 7.
Apart from simple packet capturing, there are so many other features that you can explore in this tool. You can set colouring rules for packets, which can either be temporary or permanent, i.e., for certain kinds of packets you can set certain colours, which will make it easier to understand and estimate the network traffic visually.
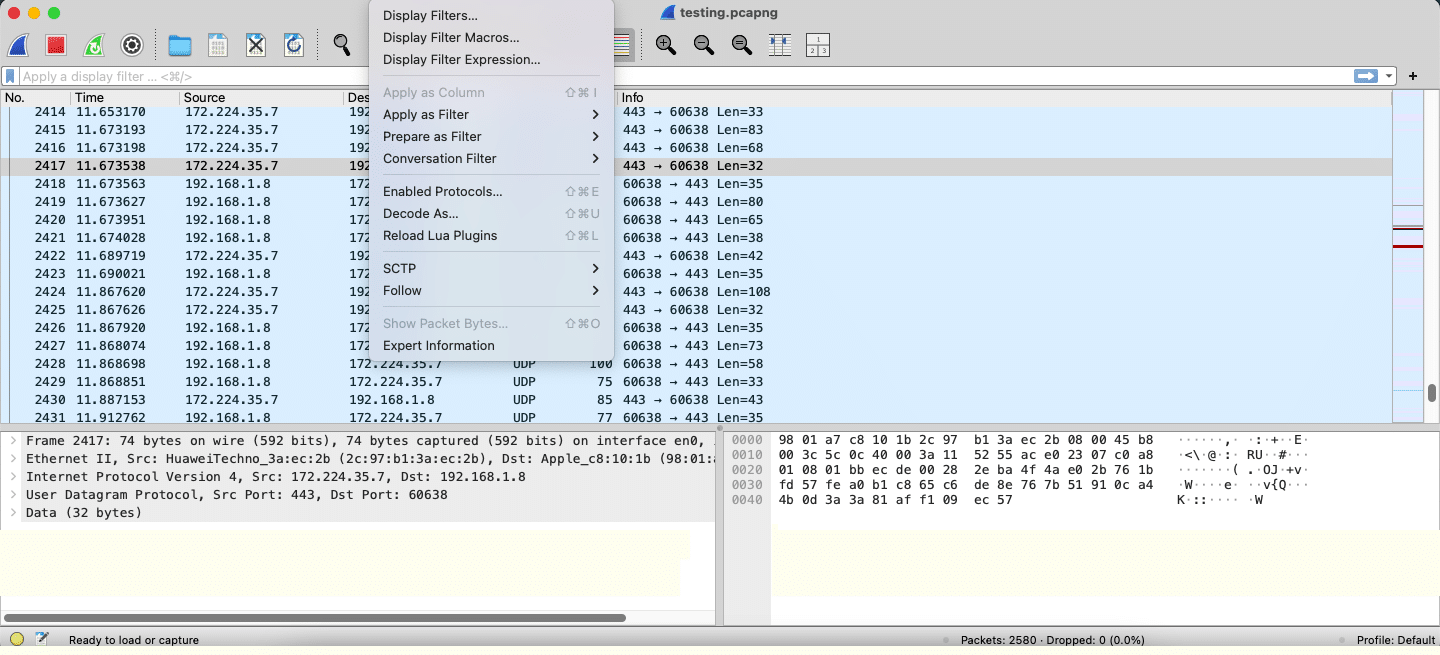
You can also set filters on the packet capture; for example, you can filter packets belonging only to a particular protocol, as shown in Figure 8.
You can take this article as the base for your research and future work. The deeper you explore, the more fun it is, which also matches Wireshark’s tagline – ‘Go Deep’. You can explore all the options and features this application provides. The best place to go to for any queries or doubts would be the official documentation in https://www.wireshark.org/docs/.


