New Relic One is a comprehensive cloud-based observability platform equipped with advanced tools and features to optimise performance monitoring, maximise data insights, and ensure scalability and reliability. It empowers users to track and optimise key performance metrics, identify bottlenecks, and streamline operations. Here’s a tutorial on how to integrate New Relic One into a Spring Boot application.
With New Relic One, the collection, storage, and analysis of telemetry data from servers, applications, containers, and beyond converge seamlessly in one centralised location. This powerful, cloud-based observability platform helps gain comprehensive insights into, visualise, debug, and optimise your entire stack.
A standout feature of New Relic One is its adaptability and versatility. Through its SDK, users can tailor their observability experience by crafting new applications, custom visualisations, and dynamic dashboards. This flexibility enables New Relic One to conform precisely to your distinct monitoring and troubleshooting needs, whether overseeing a single application or a complex, distributed system.
Understanding the New Relic One platform and its key features
New Relic One is a robust, cloud-based observability platform, delivering comprehensive monitoring and analytics capabilities tailored for modern software environments. By offering a unified view of your entire technology stack, encompassing applications, infrastructure, and digital experiences, it empowers you to optimise performance, swiftly address issues, and deliver excellent customer service.
Telemetry data from applications is seamlessly gathered by New Relic, which also provides tools for tracking and visualising this data. Distributed tracing facilitates the monitoring of request processing times, while real-time application performance monitoring is made possible through New Relic One’s application performance monitoring (APM) features. These features furnish insights into error rates, throughput, response times, and more, while also enabling observation of infrastructure health and performance across servers, containers, and cloud services.
Here are the key components and features of New Relic.
Insights: New Relic One’s Insights facilitates data exploration and analysis, empowering users to gain insightful knowledge about their infrastructure and applications.
Its robust query language (NRQL) allows for complex searches on data, aiding in the identification of patterns and trends. By creating custom visualisations and dashboards, users can make data-driven decisions, enhance performance, and increase problem-solving proficiency.

Dashboards: New Relic One dashboards enable the creation of customised data visualisations in real-time, providing insights into infrastructure and application performance. With a variety of widgets such as tables, graphs, and charts, users can visually represent key information and performance indicators. Dashboards offer a quick overview of application and infrastructure functionality, facilitating rapid issue identification and resolution.
Applied Intelligence: Applied Intelligence in New Relic One leverages machine learning algorithms to proactively detect and alert users to potential issues. By analysing data to identify trends and abnormalities, it assists in resolving issues before they impact users negatively. Applied Intelligence enhances application reliability and effectiveness by detecting and addressing issues early on.
Full-Stack Observability: Full-Stack Observability provides comprehensive monitoring of applications and infrastructure, offering visibility into every layer of the stack. With capabilities for tracking application performance, infrastructure health, and user experience, users can monitor and improve every aspect of the system. Full-Stack Observability ensures application and infrastructure reliability, scalability, and performance.
Programmability: New Relic One’s programmability allows users to enhance its functionality and tailor it to their unique requirements. By leveraging New Relic’s APIs and SDKs, users can write custom code to automate procedures, integrate with other systems, and enhance New Relic One’s features. Programmability makes New Relic One more versatile and potent, enabling customisation to meet specific needs.
Getting started with New Relic One
Let us explore how to integrate New Relic One into a Spring Boot application.
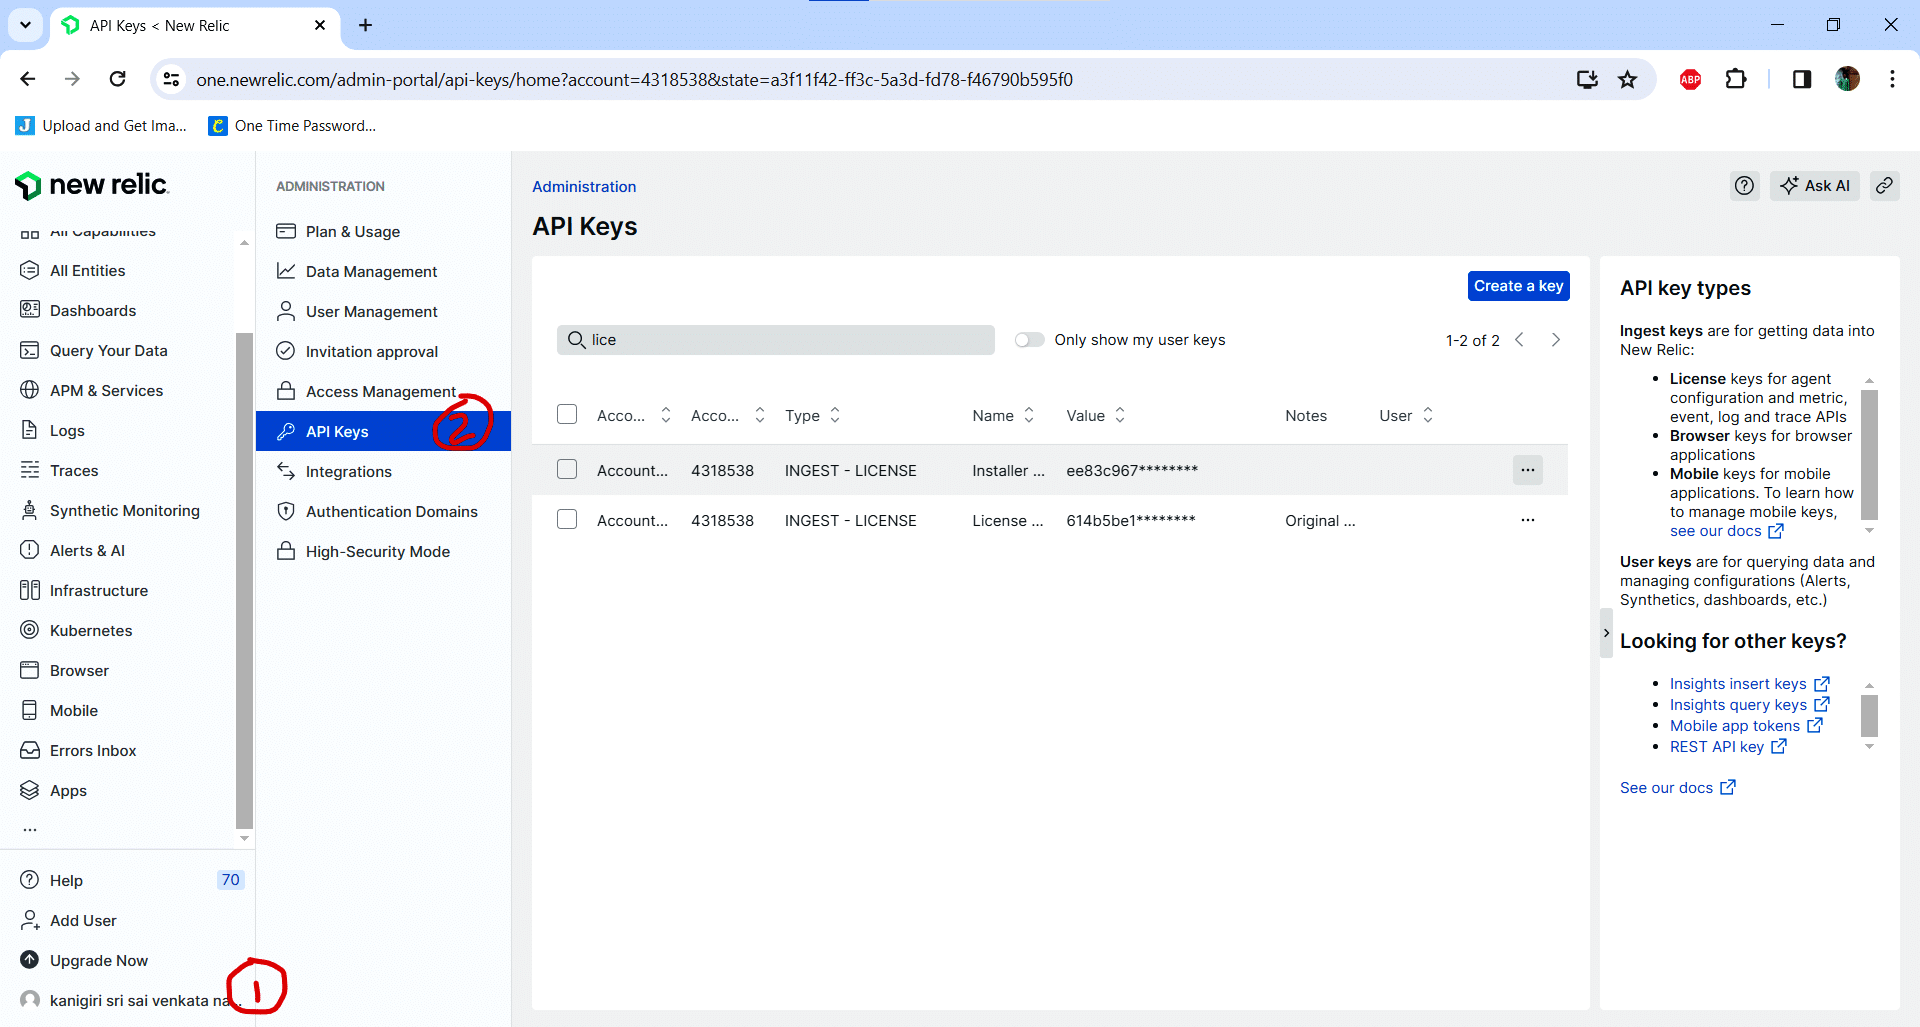
Create an account on the New Relic One website by visiting https://newrelic.com/signup. After signing up, verify your email address by clicking on the verification link sent to your provided email inbox, and then proceed to create a password. Once logged in, navigate to your profile settings. You can find your licence key, which is essential for instrumenting different applications, under the section titled ‘API Keys’.
Instrumenting New Relic One into your Spring Boot application
Here’s how you can integrate New Relic One into your existing Spring Boot application.
Visit the New Relic website at https://docs.newrelic.com/docs/release-notes/agent-release-notes/java-release-notes/. Click on the ‘Download the New Java Version’ button, which will direct you to a page displaying various zip folders available for download. Choose the zip folder named ‘newrelic-java.zip’ as indicated in the image above.
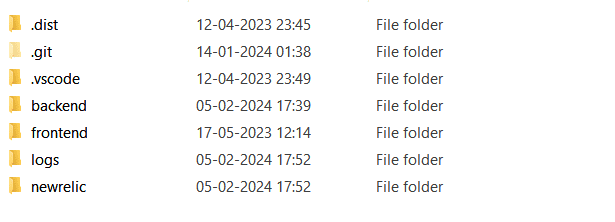
Extract the downloaded zip folder into your project directory. Your project directory structure should resemble the image in Figure 3.
Open the file named newrelic.yml located within the extracted folder. Inside this file, you’ll find two variables named ‘license_key’ and ‘app_name’ left blank. Populate the ‘license_key’ variable with your New Relic licence key and specify the name of your application in the ‘app_name’ variable. The application name can be customised as per your preference.
To execute New Relic alongside your Spring Boot application, use the following command while running the application:
java -javaagent:<path to your new relic jar>/newrelic.jar -jar <path to your application jar>/<your application jar name>.jar
For the <your application jar name>.jar file, you must first generate it using the command mvn install. This command generates a jar file in the target folder.
By following these steps, you’ll seamlessly integrate New Relic One into your Spring Boot application, enabling comprehensive monitoring and performance optimisation.
Navigating the New Relic One interface
Once your Spring Boot application is running alongside the New Relic agent, you can monitor the flow of information being sent to the New Relic server. You can verify the correct configuration either by examining the logs in the designated logs folder or by accessing the New Relic One website to check for the presence of your application.
If the New Relic agent is successfully transmitting information to the server, log in to the New Relic website and navigate to the ‘APM’ and ‘Services’ section. In Figure 4, we can find the name of our application listed.
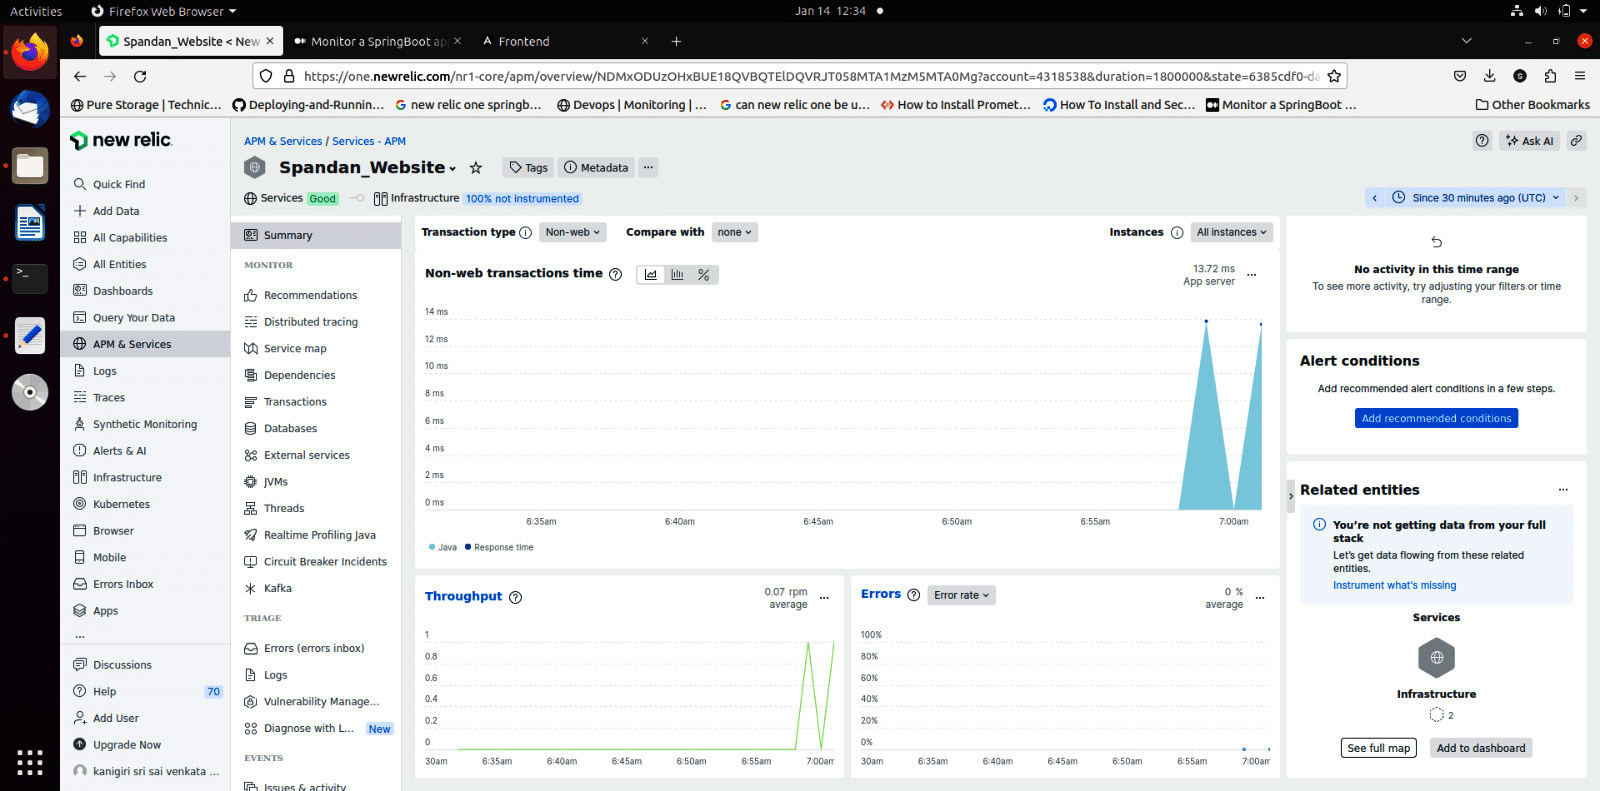
Within this dashboard, you can access various metrics such as throughput, latency, and transaction time. Additionally, the platform provides insights into the time taken by each database operation. You can also analyse the time taken by each transaction and the duration of each operation within the transaction.
By leveraging these features, you can gain comprehensive insights into the performance of your application and its underlying components, facilitating effective optimisation and troubleshooting.
Advanced features and functionality of NRQL
The New Relic Query Language (NRQL) serves as a powerful tool for querying and analysing data within New Relic Insights. NRQL enables users to access and scrutinise data collected from diverse sources, including New Relic’s agents, to gain insights into their infrastructure, applications, and user experience. By utilising NRQL queries, users can visually analyse their data within New Relic Insights, creating charts and visualisations to aid in understanding and decision-making. Notably, NRQL’s syntax closely resembles that of SQL, with minor variations in writing conventions.
Key NRQL keywords include:
- SELECT: The ‘SELECT’ keyword is utilised to specify a particular metric or a function applied to a metric.
- FROM: The ‘FROM’ keyword specifies the event or metric data source from which data is to be retrieved. It is fundamental in NRQL queries and is paired with the SELECT statement to define the data to be queried.
- FACET: The ‘FACET’ keyword segments data for analysis, akin to the ‘GROUP BY’ clause in SQL.
- WHERE: The ‘WHERE’ keyword filters data based on specified criteria, such as selecting data from a particular application.
- TIMEWINDOW function: This function specifies a time window during which data is captured, using syntax like ‘SINCE 1 hour ago’ and ‘UNTIL’ to specify the end time for data extraction.
- COMPARE WITH: The ‘COMPARE WITH’ keyword facilitates comparison of metrics between two different time ranges, aiding in trend analysis.
- ORDER BY: The ‘ORDER BY’ keyword arranges query results based on specified criteria, such as the number of transactions, in descending order.
- Mathematical aggregation functions: NRQL supports mathematical aggregation functions like min(), max(), sum(), etc, enabling further analysis and computation on metrics.
By leveraging these advanced features and functionality of NRQL, users can gain deeper insights into their data, facilitating informed decision-making and optimisation efforts.
As an example, instructions for an NRQL query to retrieve the number of successful web transactions in the last 24 hours are provided below:
SELECT count (*) AS ‘ Number of Transactions ‘ ,
average ( duration ) AS ‘ Average Duration ‘ ,
max ( duration ) AS ‘ Max Duration ‘
FROM Transaction
WHERE appName = ‘ My Application ‘
AND transactionType = ‘ Web ‘
AND httpResponseCode = ‘ 200 ‘
FACET countryCode
SINCE 1 day ago
UNTIL 1 hour ago
LIMIT 10
ORDER BY ‘ Number of Transactions ‘ DESC
Configuration of alerts and notifications
Setting up alerts for specific metrics in New Relic involves a straightforward process. Follow these steps to configure alerts and receive notifications when certain metrics reach predefined threshold values.
Login and access alerts and AI section: Log in to New Relic and navigate to the ‘Alerts and AI’ section. Proceed to the ‘Alert conditions’ subsection.
Initiate new alert condition: Click on the ‘+ New Alert Condition’ button located at the top right corner of the web page. This action opens a dialog section for configuring the alert condition.
Guided mode selection: Opt for the ‘Use guided mode’ option to simplify the alert setup process.
Select service and entity: Choose the ‘Services – APM’ option and proceed to the next step.
Specify website for alert: Select the website or application entity for which you want to create the alert. For example, we chose ‘Spandan Website’.
Choose metric: Select the metric for which you want to set the alert, such as ‘Response Time’ under the ‘Golden Metrics’ section. Alternatively, create a new metric using the ‘Other Metrics’ option.
Set thresholds: Define thresholds for the metric to trigger the alert. Configure limits and intervals accordingly.
Aggregation time and interval: Specify the aggregation time period and interval for the signal. Set a time limit cutoff for continuous threshold exceedance.
Add alert details: Provide a name for the alert and select a policy. Optionally, create a new policy if required.
Save and setup notifications: Click on the ‘Save and setup notifications’ button to proceed.
Activate workflow: Choose the method for receiving alerts, such as email, and activate the workflow.
Create email destination: Create a new email destination by providing your email address and saving it.
Activate workflow: Activate the workflow to complete the email setup.
Close and review: Close the setup and review the alert configuration in the ‘Alert conditions’ section.
Test notification: Optionally, send a test notification to ensure the alert setup is working correctly.
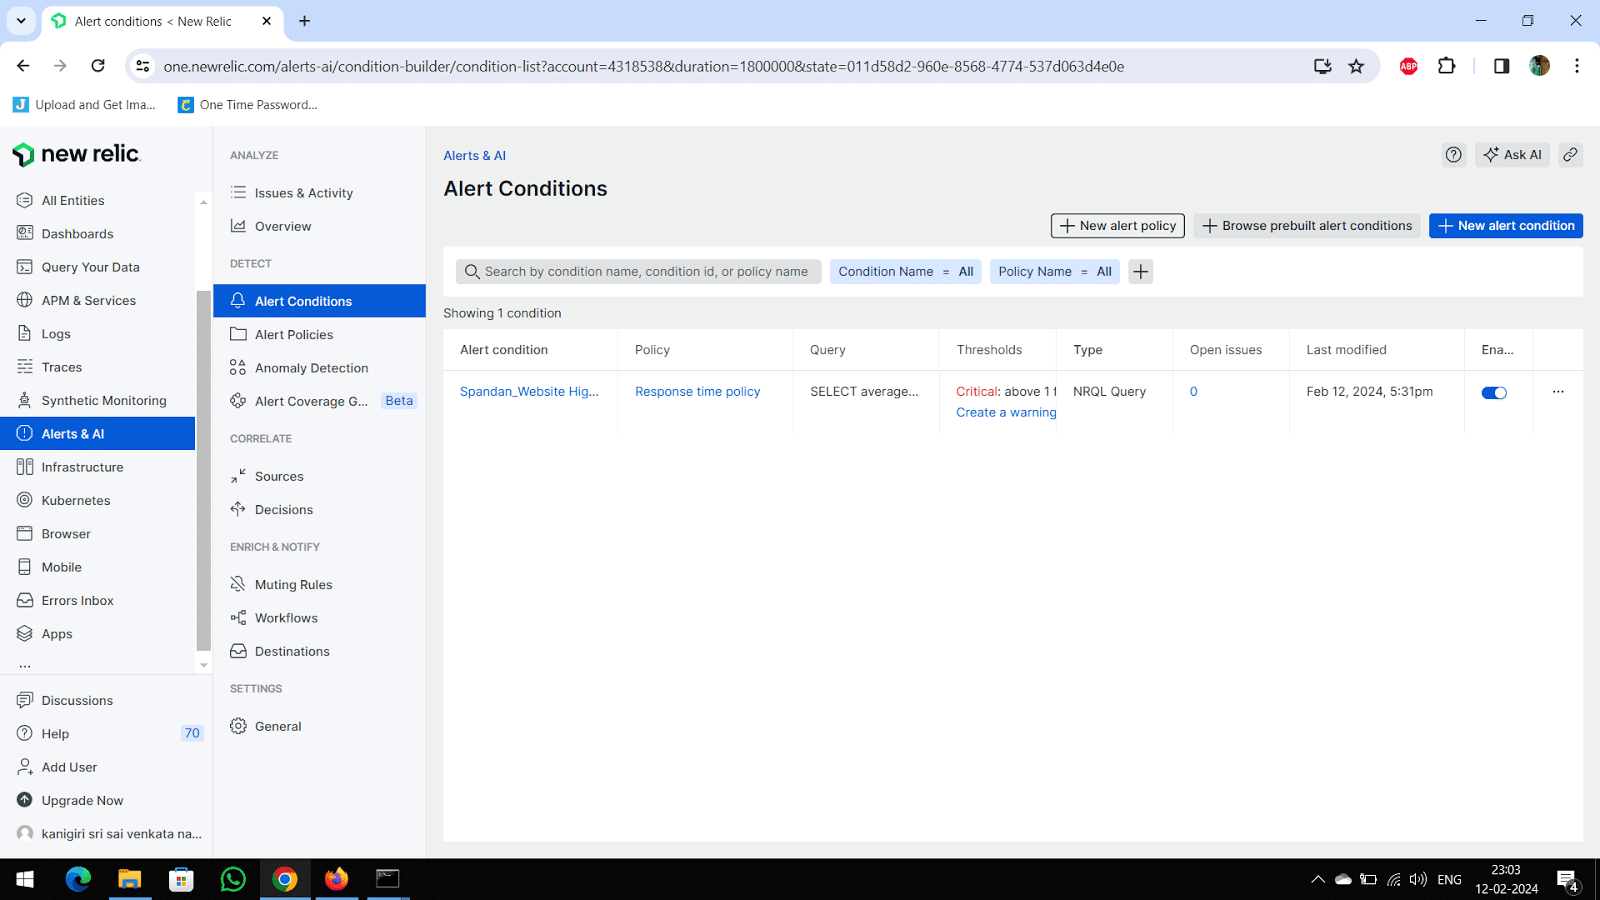
These steps will help you successfully configure alerts in New Relic, allowing you to monitor specific metrics and receive timely notifications when threshold values are exceeded. You should see an alert created in the ‘Alert Conditions’ section under ‘Alerts and AI’ as shown in Figure 5.
Best practices for effective usage of New Relic One
Optimising performance monitoring: New Relic One offers a suite of tools and features to optimise performance monitoring effectively.
- Custom dashboards: New Relic One’s custom dashboard functionality can be leveraged to tailor monitoring to your specific needs. Add widgets to track metrics such as response times, error rates, and throughput.
- Distributed tracing: The platform’s distributed tracing capabilities can be used to trace requests across your microservices architecture. Identify performance bottlenecks and optimise your application’s performance accordingly.
- Application performance monitoring (APM): You can gain detailed insights into your application’s performance with New Relic One’s APM. Access transaction traces, error analytics, and application dependencies to pinpoint issues and optimise performance effectively.
Maximising the value of data insights: To extract maximum value from your data insights, follow these practices.
- Data visualisation: Harness New Relic One’s robust data visualisation tools, including charts, graphs, and heatmaps, to visualise data and derive valuable insights.
- Custom charts and dashboards: Create custom charts and dashboards within New Relic One to visualise specific metrics and trends relevant to your business goals.
- Advanced analytics: Utilise advanced analytics features like NRQL to perform complex queries and analyses on your data. This enables you to derive deeper insights and make informed decisions.
Ensuring scalability and reliability: To ensure scalability and reliability of your monitoring practices, consider the following.
- Scalability: New Relic One is designed to be highly scalable, enabling monitoring and management of large-scale applications and infrastructure seamlessly.
- Reliability: You can leverage New Relic One’s alerting and monitoring features to ensure the reliability of your applications. Receive alerts for potential issues before they impact your users, thus maintaining uptime and user satisfaction.
- Infrastructure monitoring: New Relic One’s infrastructure monitoring capabilities can be used to monitor the performance and health of your infrastructure components such as servers, containers, and databases. Ensure they remain reliable and scalable to support your business needs effectively.
| Note: New Relic is a proprietary observability platform. However, you can download a free trial version to explore its features in conjunction with your open source projects. New Relic One integrates with existing open source solutions to provide end-to-end visibility, scalability, and better performance. If the platform meets your project or product requirements, you can then opt for the licensed version to continue using its full capabilities. |
In essence, by leveraging New Relic One’s robust capabilities and adhering to best practices, organisations can optimise their performance monitoring efforts, unlock valuable insights, and ensure the scalability and reliability of their applications and infrastructure, ultimately driving business success in today’s dynamic digital landscape.


