Managing data can be laborious and demanding. But the task is critical in the age of AI. Help is available in the form of data management tools that are both open source and proprietary.
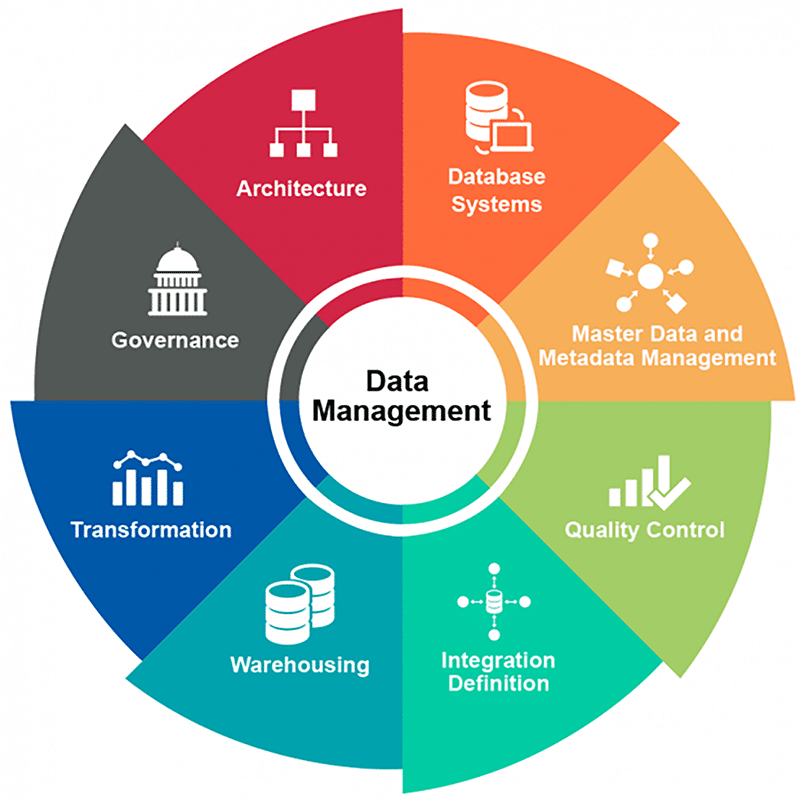
Data management is the process of gathering, arranging, safeguarding and preserving an organisation’s data so that it may be examined for business choices. It helps simplify and shorten the time required for critical tasks. For instance, to prepare raw data for analysis, it must be cleaned, formatted and corrected. It may also involve merging different datasets like .csv, .tsv, and .xlsx. These could be structured, semi-structured or unstructured.
ETL and ELT
The automated flow of data between systems is made possible by data pipelines. The purpose of ETL (extract, transform, load) is to load data into an organisation’s data warehouse after transforming it from one system. ELT (extract, load and transform) performs data transformations directly within the data warehouse. Unlike ETL, ELT allows raw data to be sent directly to the data warehouse, eliminating the need for staging processes.
Data lakes and data warehouses
A data lake is a repository that stores all your organisation’s data (structured, semi-structured and unstructured) while data warehouses are locations where different data sources may be combined to support specific business intelligence and analytics needs.
Data architecture documents an organisation’s data assets, maps how data flows through its systems, and provides a blueprint for managing data.
How is data management different from data governance?
Data governance is a set of procedures and guidelines on data access, use and management. Data management includes processes and tools to ingest, store, catalogue, prep, explore and transform data, so that you can use it for decision-making. Also, data governance is a practice to increase the business value of data without compromising its security, integrity, or privacy while data management is a process that supports data consumption by following those data governance guidelines.

Data management tools
ETL and data integration tools
ETL is the process of copying data from multiple sources into a destination system that represents the data. Data integration, on the other hand, refers to the process of combining data from multiple sources into a single destination.
Hevo Data: This tool allows you to replicate data in near real-time from multiple sources (including Snowflake, BigQuery, Redshift and Databricks) to the destination.
Talend Open Studio: Talend is one of the best data management software that provides corporations with data integration, integrity and preparation. It is an open source data integration solution that was launched by Talend in October 2006. Data transformation features offered by Talend include filtering, flattening/normalising, aggregating, replicating, joining and temporal windowing.
Cloud data management tools
There are a lot more data warehousing and management options available now that storage and bandwidth are less expensive. Cloud-based technologies have been embraced by companies that need to store, analyse and sort through massive amounts of data in order to be more efficient. The development of strong cloud data management solutions over the last five to ten years has made this feasible. Although these industries are dominated by behemoths like Google and Amazon, technology has allowed numerous smaller businesses to provide tools for clients with varying data demands. Three well-known enterprise data management tools are as follows.
Amazon Web Services: Multiple tools from AWS can be integrated to create a cloud data management track. This Amazon subsidiary offers pay-as-you-go cloud computing platforms and APIs on demand. The following are a few services provided by Amazon Web Services:
- Amazon Redshift for data warehousing
- Amazon Athena for SQL-based analytics
- Amazon Quicksight for dashboard and data visualisation
- Amazon Glacier for long-term backup and storage
- Amazon S3 (Simple Storage Service) for temporary and intermediate storage
Microsoft Azure: The platform offered by Microsoft Azure offers multiple options for configuring a cloud-based data management system. Additionally, it offers practical analytical tools for usage with data saved on Azure. Azure offers a robust toolkit for managing various database and data warehouse designs.
- Offers several storage services, including Blob, Table, Queue and File
- Private cloud deployments are available
- NoSQL-style table storage options
- Azure Data Explorer (ADX) enables a user to perform real-time analysis of very large streaming data without the need for preprocessing
Google Cloud Platform (GCP): GCP offers a large set of tools for cloud-based data management. It comes with a workflow manager that ties the different components together. It offers:
- Google Data Studio for graphical user interface-based analysis and dashboard construction
- Cloud Datalab for code-based data science
- ML engine for advanced analysis through ML and AI
- Google BigQuery for tabular data storage
- Cloud BigTable for NoSQL database-style storage
- Connections to BI tools like Tableau, Looker and Power BI
Data visualisation and data analytics tools
Data visualisation tools allow you to view your data in a pictorial format (like graphs and charts), which makes it easier to draw coherent insights from it, thus simplifying the analytical process. Here are a few data visualisation and data analytics tools you can integrate into your business model (these include tools that are not open source).
| Note: Matplotlib, is an open source Python library which is also used for data visualising and plotting but requires a high level of coding knowledge. On the other hand, Power BI and Tableau are robust tools with user-friendly interfaces suitable for business intelligence and data visualisation. |
Tableau: Tableau is an excellent data visualisation and business intelligence (BI) tool used for reporting and analysing vast volumes of data. It can easily connect to different data sources.
- It allows easy access to visualisations for partners, teams and clients.
- It allows you to create interactive maps automatically.
- It provides unlimited data exploration with interactive and intuitive dashboards.
- Dashboard setup hardly takes a few minutes with data from popular web applications.
Power BI: Microsoft Power BI provides interactive visualisations and BI (business intelligence) capabilities with a simple interface, designed to be used by analysts and data scientists alike.
- It offers a library of pre-built connectors.
- A simple drag-and-drop interface is provided by this tool.
The challenges
The need for massive data storage: This is one of the most common issues, as enterprises need multiple platforms to store data flowing from multiple sources.
Duplication of data is inevitable due to multiple systems capturing the same information and storing it across multiple tables. Data deduplication techniques can help recognise identical points and flag them for duplication because different data source providers may write the same information in different ways.
Incomplete and incorrect data: If stakeholders are unable to access and use data in a productive way, then even the most advanced data management technologies are useless for a business.
If the data isn’t displayed in an understandable dashboard that addresses pertinent queries and gives the necessary insights to the appropriate individuals, it won’t be of any use.
If data is manually entered, fields may be incomplete or incorrect. The accuracy of data analysis is contingent upon the quality of the underlying data. This implies that human mistakes can occur in data.
Real-time data analysis
Data, in its raw form, has limited usefulness even if it is of high quality. Large-scale data analysis and extraction can benefit from technology, but there are still numerous obstacles to overcome, such as operating the tool appropriately and extracting the data logically, among other things.
With a real-time dashboard, you may access a multitude of sophisticated tools that offer insights into the functioning of your organisation. You require a platform that efficiently handles the unprocessed data and extracts insightful knowledge from it.


