


Going down memory lane, it’s easy to see how changing needs have helped evolve log analysers since the mid-2000s. What worked then, will not work today. But the journey is to be cherished.
It was the late nineties, and I had about 3-4 years of development experience by then. I had just transitioned from the GSM field to the world of network management systems (NMS) after joining a multinational company in Bengaluru. Although my master’s degree was in computer networks, NMS was entirely new to me. I was familiar with hubs, routers, switches, IP addresses, RFCs, and protocols, but only in theory. This was the first time I had hands-on experience with NMS.
From a technological standpoint, I was quite proficient. I coded in C++ and worked on HP-UX, a variant of UNIX. I had experience with large-scale, mission-critical systems. In a way, I was filled with youthful confidence when I began working with NMS.
In my new role, I was assigned the task of enhancing a log analysis tool as part of a larger NMS. NMS are structured around the FCAPS model, which stands for fault management, configuration management, accounting, performance, and security. This model is defined by ISO. The log analysis tool our team was developing fell under the fault management category. Figure 1 captures the arrangement.
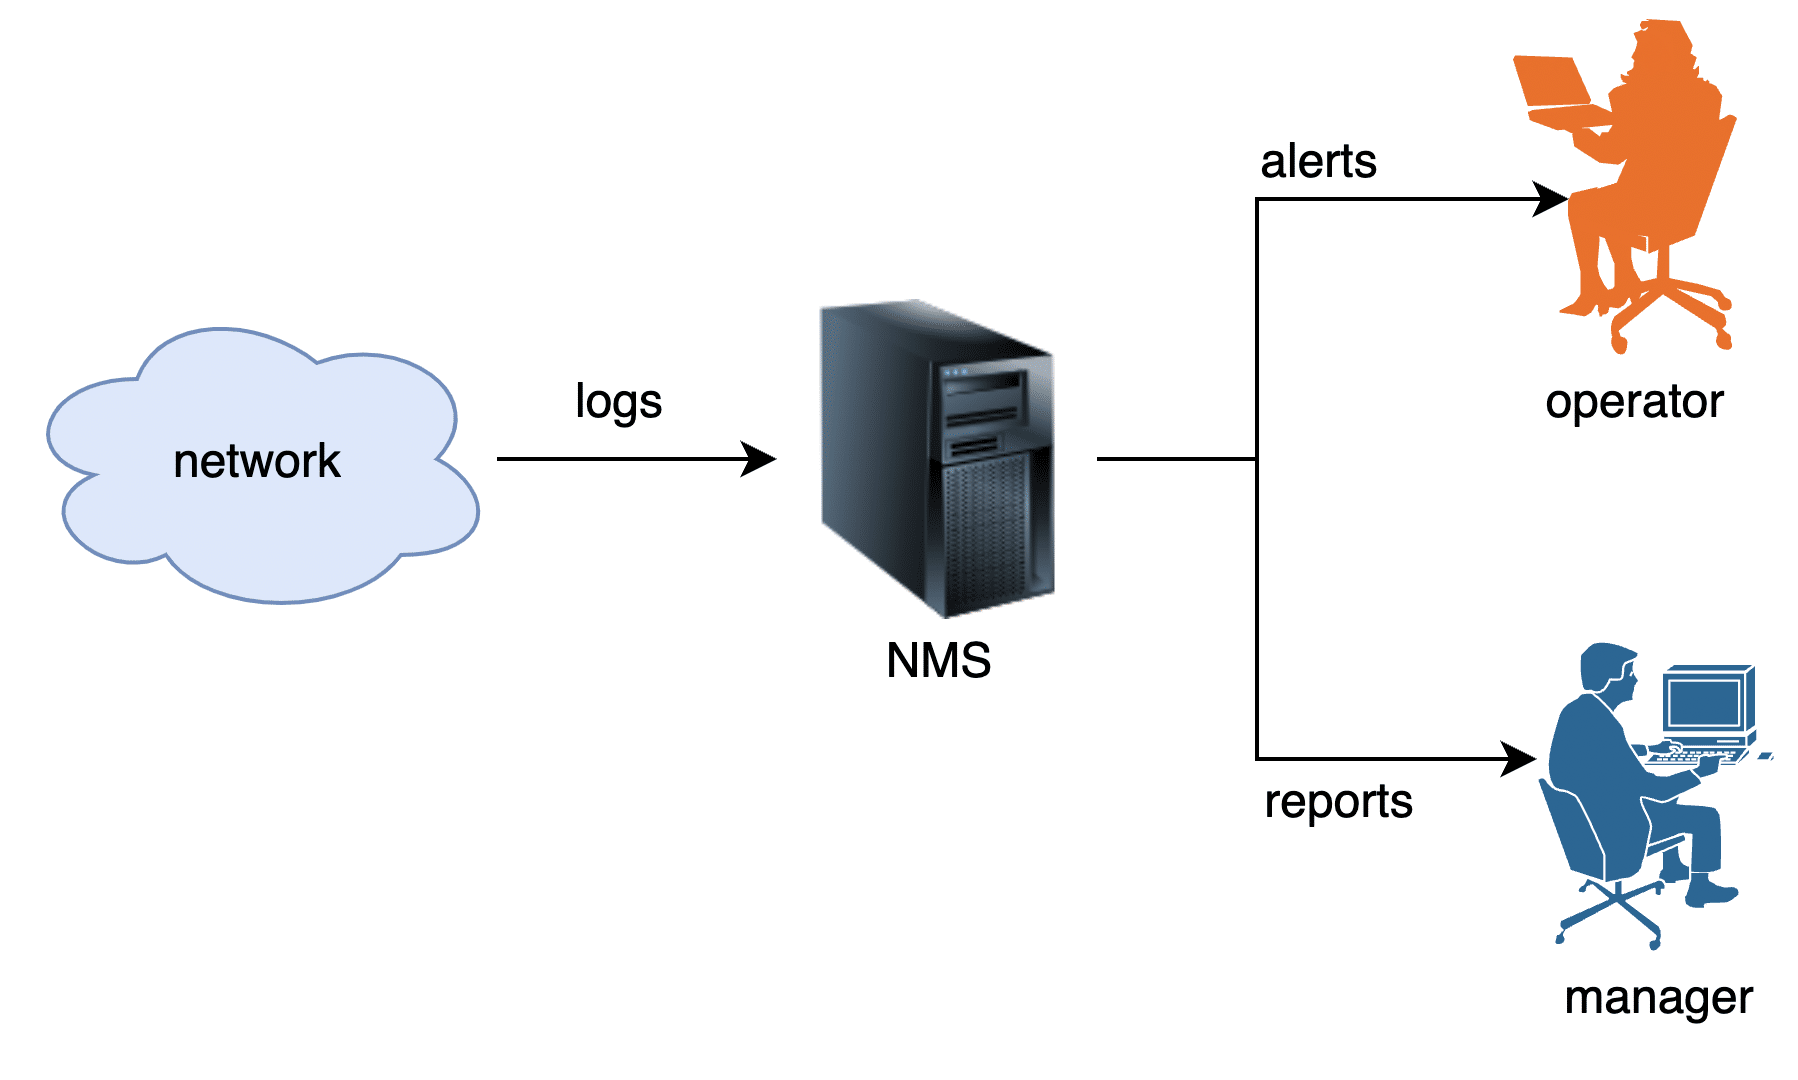
The requirement was straightforward: the log analysis tool needed to gather system logs from all devices across the network, store them in a database, analyse them, and take necessary actions.
This NMS was intended for use by large service providers. In the US market, the adoption of GSM mobile phones was slower compared to VoIP (Voice over IP). While mobile telephony was just beginning in India, offices were transitioning from PSTN technology to VoIP, and VoIP phones were becoming commonplace on every employee’s desk. Each time a call was made or received, or a VoIP phone was powered on or off, a system log was generated. Our log analysis tool needed to collect and analyse all these logs.
Due to their lightweight nature, network devices, including VoIP phones, used to transmit logs to the NMS station using the UDP port. As you’re aware, UDP, or User Datagram Protocol, is an unreliable protocol. Unless the datagram is immediately read, it is lost forever.
The log analysis tool I inherited from the previous release could process approximately 10 logs per second. Essentially, it was a Java application with a single thread that sequentially read, stored, analysed a log, executed configured actions, and then moved on to the next log message from the UDP port. Figure 2 describes the architecture in detail.
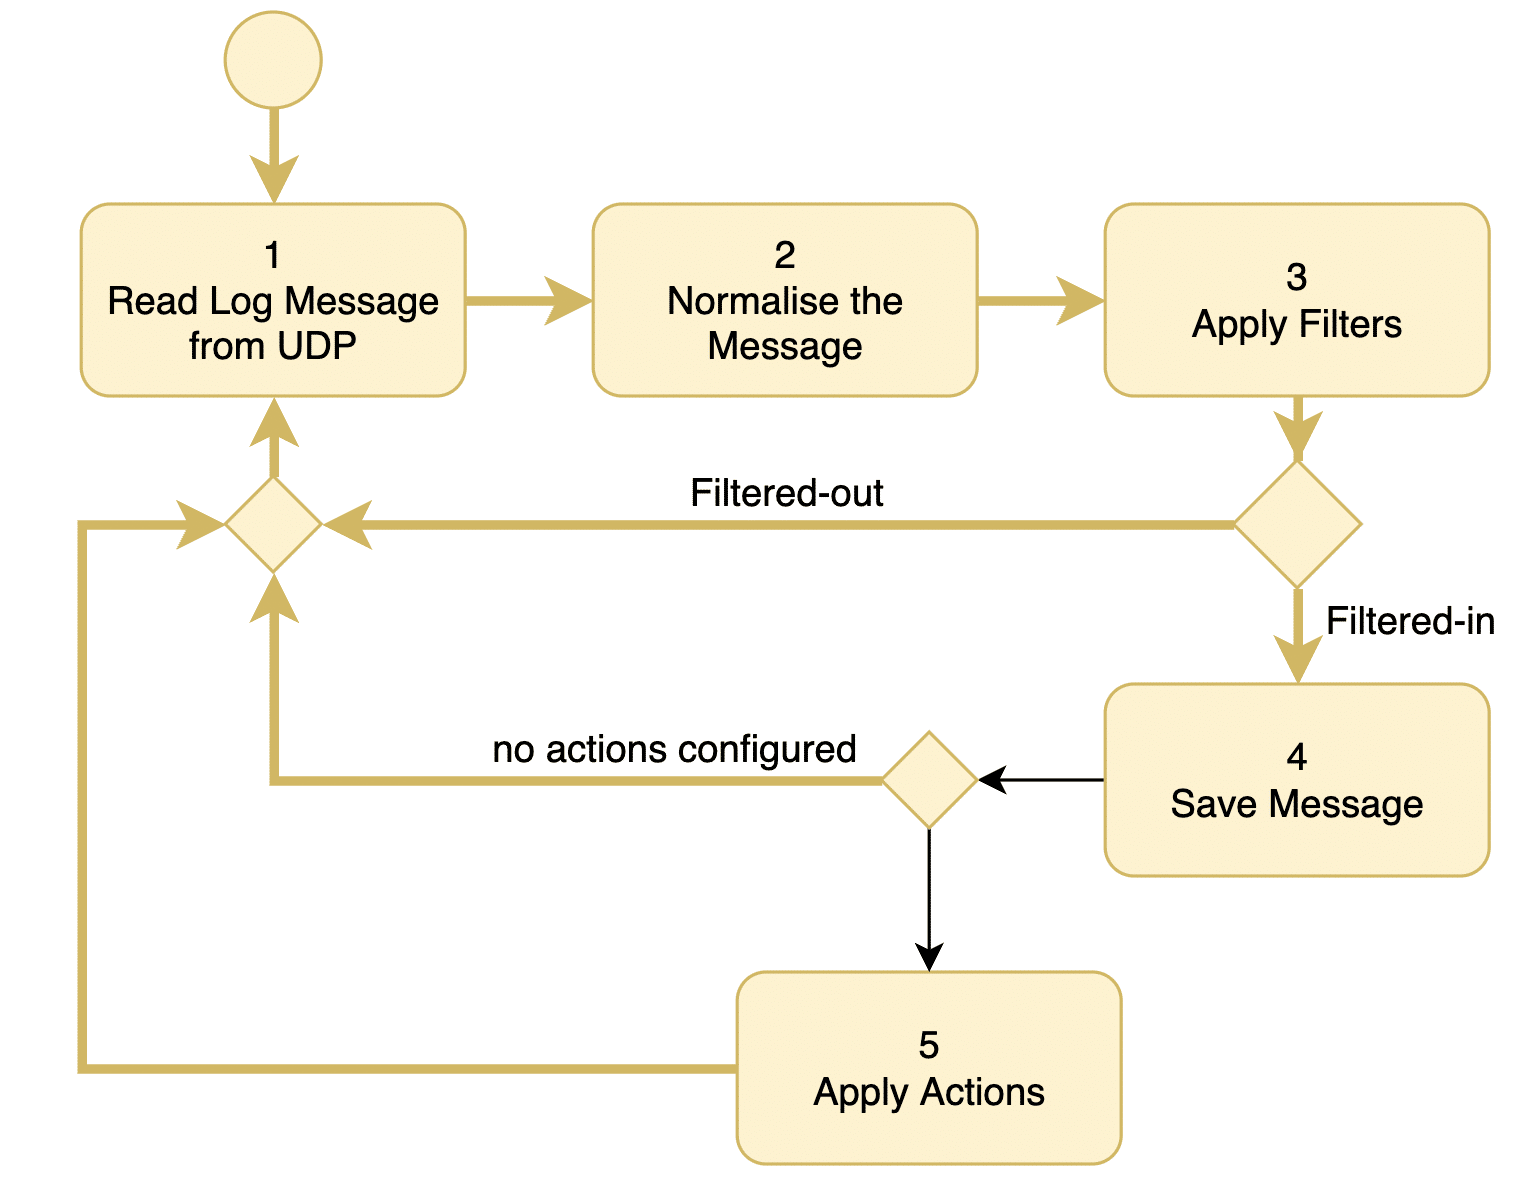
In the initial step, the thread retrieves the next available log from the UDP port.
Following normalisation, filters are applied to determine if the message can be disregarded. If the log is deemed unimportant according to the filtering rules, the thread returns to step 1.
In the fourth step, the log message is stored in the database. These stored logs serve as valuable resources for generating reports and conducting further analysis later.
Next, in the fifth step, the thread assesses if the log warrants any actions. The administrator defines actions, such as sending emails to administrators and paging an operator, based on the nature of the log. Subsequently, the thread returns to step 1.
When networks are smaller and the number of generated logs is limited, handling 10 logs per second is usually adequate. However, with the proliferation of VoIP phones, the rate of log generation increased, and our log analysis tool struggled to keep up. Consequently, many logs were dropped at the UDP port. If a dropped log message was critical, the NMS administrator remained unaware of the issue, leading to unreported and unattended network glitches.
We were tasked with improving the performance of the log analysis tool to handle a minimum of 100 logs per second. Our product marketing team determined through their research that this level of performance would effectively accommodate the size of the networks.
I began my work by exploring avenues for performance enhancement. I fine-tuned database operations, string processing routines, and other aspects, hoping to save a few CPU cycles. Unfortunately, this approach did not yield much success.
With no room for further enhancement within the current framework, I opted to revamp the system using a hub-and-spoke architecture, depicted in Figure 3.
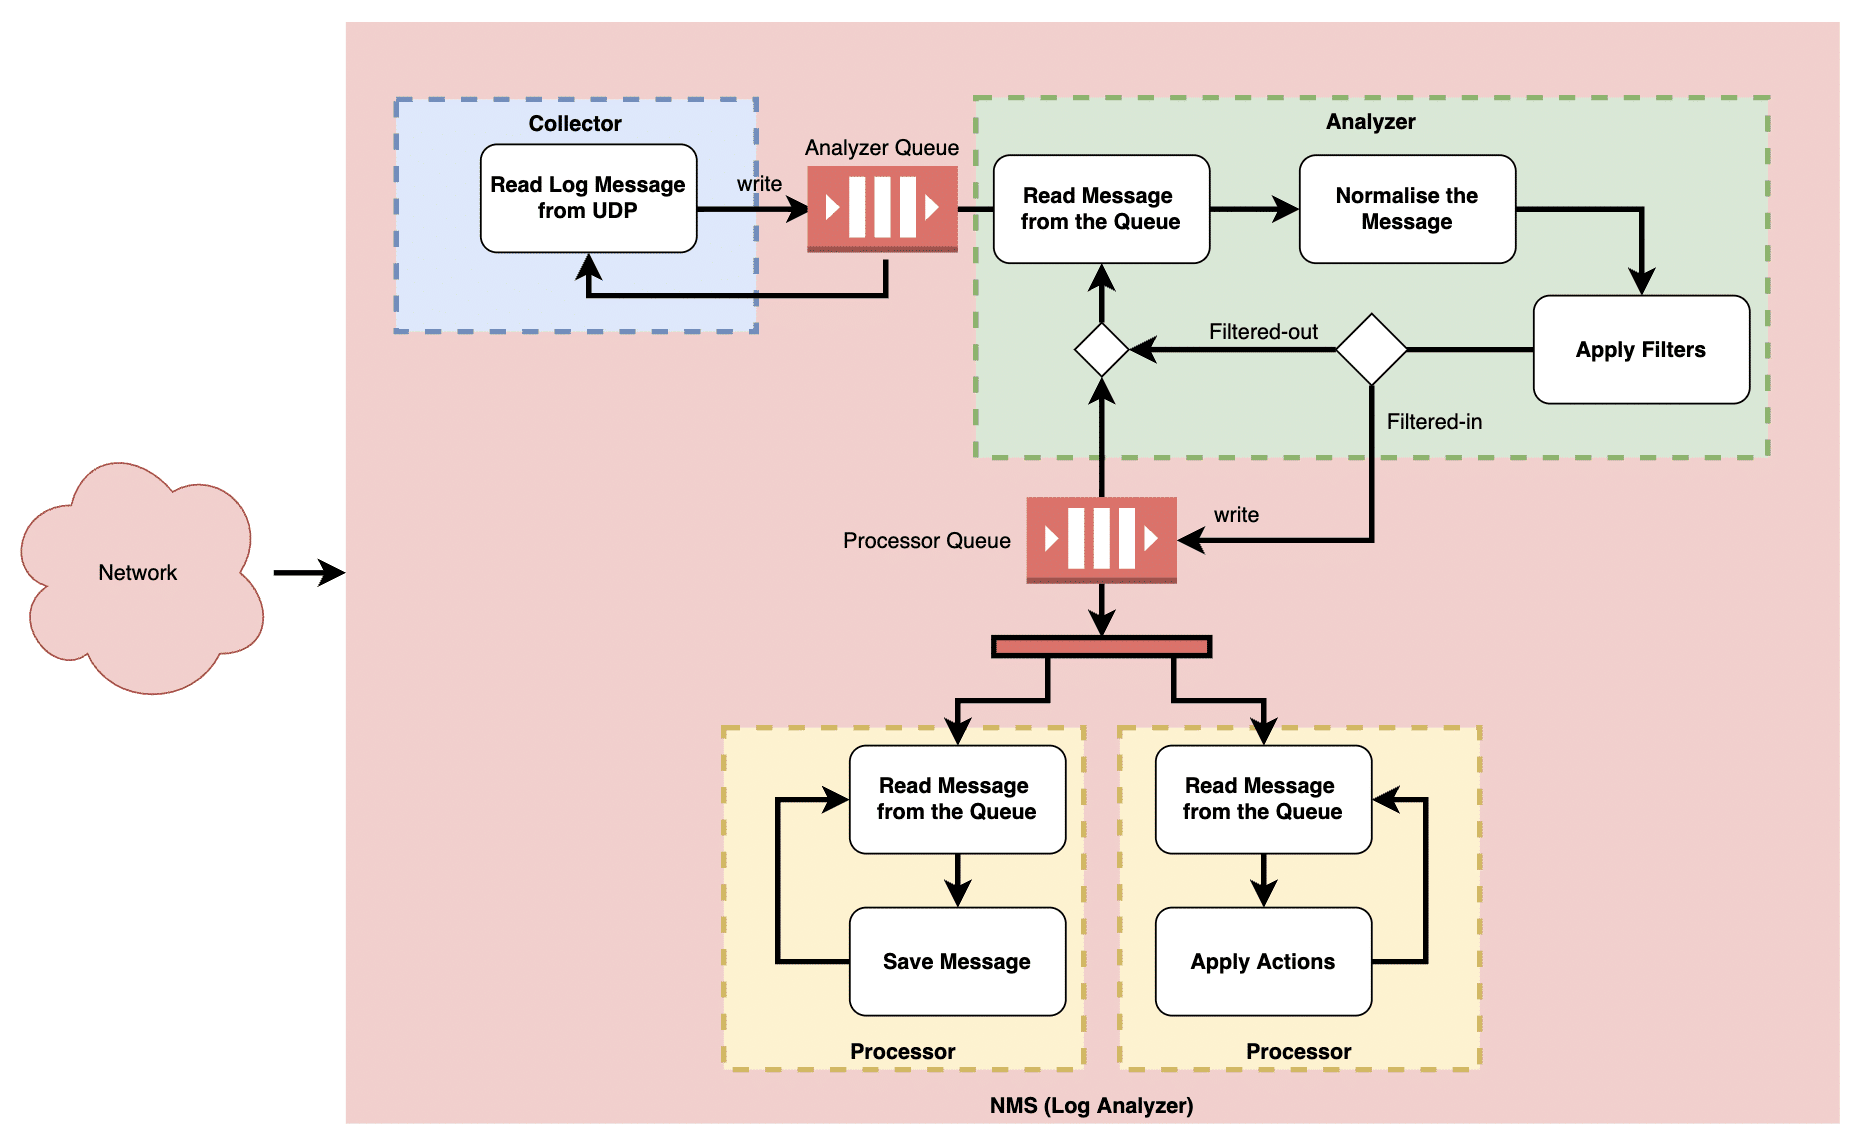
Unlike the previous setup where a single thread processed logs sequentially, the redesigned system featured multiple threads: collectors, analysers, and processors.
The collector thread retrieves logs from the UDP port as they become available and promptly deposits them into the analyser queue. This thread solely focuses on log collection, ensuring that all logs are captured by the system without any being dropped.
The analyser thread retrieves logs from the analyser queue, standardises them, and applies filters. Logs that meet the filter criteria are then transferred to the processor queue. When operating on multi-core processors, multiple analyser threads can be scheduled simultaneously to enhance performance.
Subsequently, processor threads retrieve logs from the processor queue. Various types of processor threads can be implemented. For instance, one thread may store logs in the database, another may send emails, and yet another may trigger page alerts based on configured actions.
Although the processing speed of the analyser and processor threads may be slightly slower, this does not pose a problem as the collector thread continuously writes new logs to the collector queue. By adjusting the queue sizes and the number of threads, the system can dynamically scale to handle higher loads.
However, does this design hold up well now? Certainly not! With the proliferation of intelligent devices, IoT devices, and so forth, network sizes have grown exponentially. While the multi-threaded design illustrated in Figure 3 can scale to some extent, it has its limitations in vertical scaling.
For contemporary requirements, I would opt for horizontal scaling over vertical scaling. This means redesigning the system as a distributed system, as depicted in Figure 4.
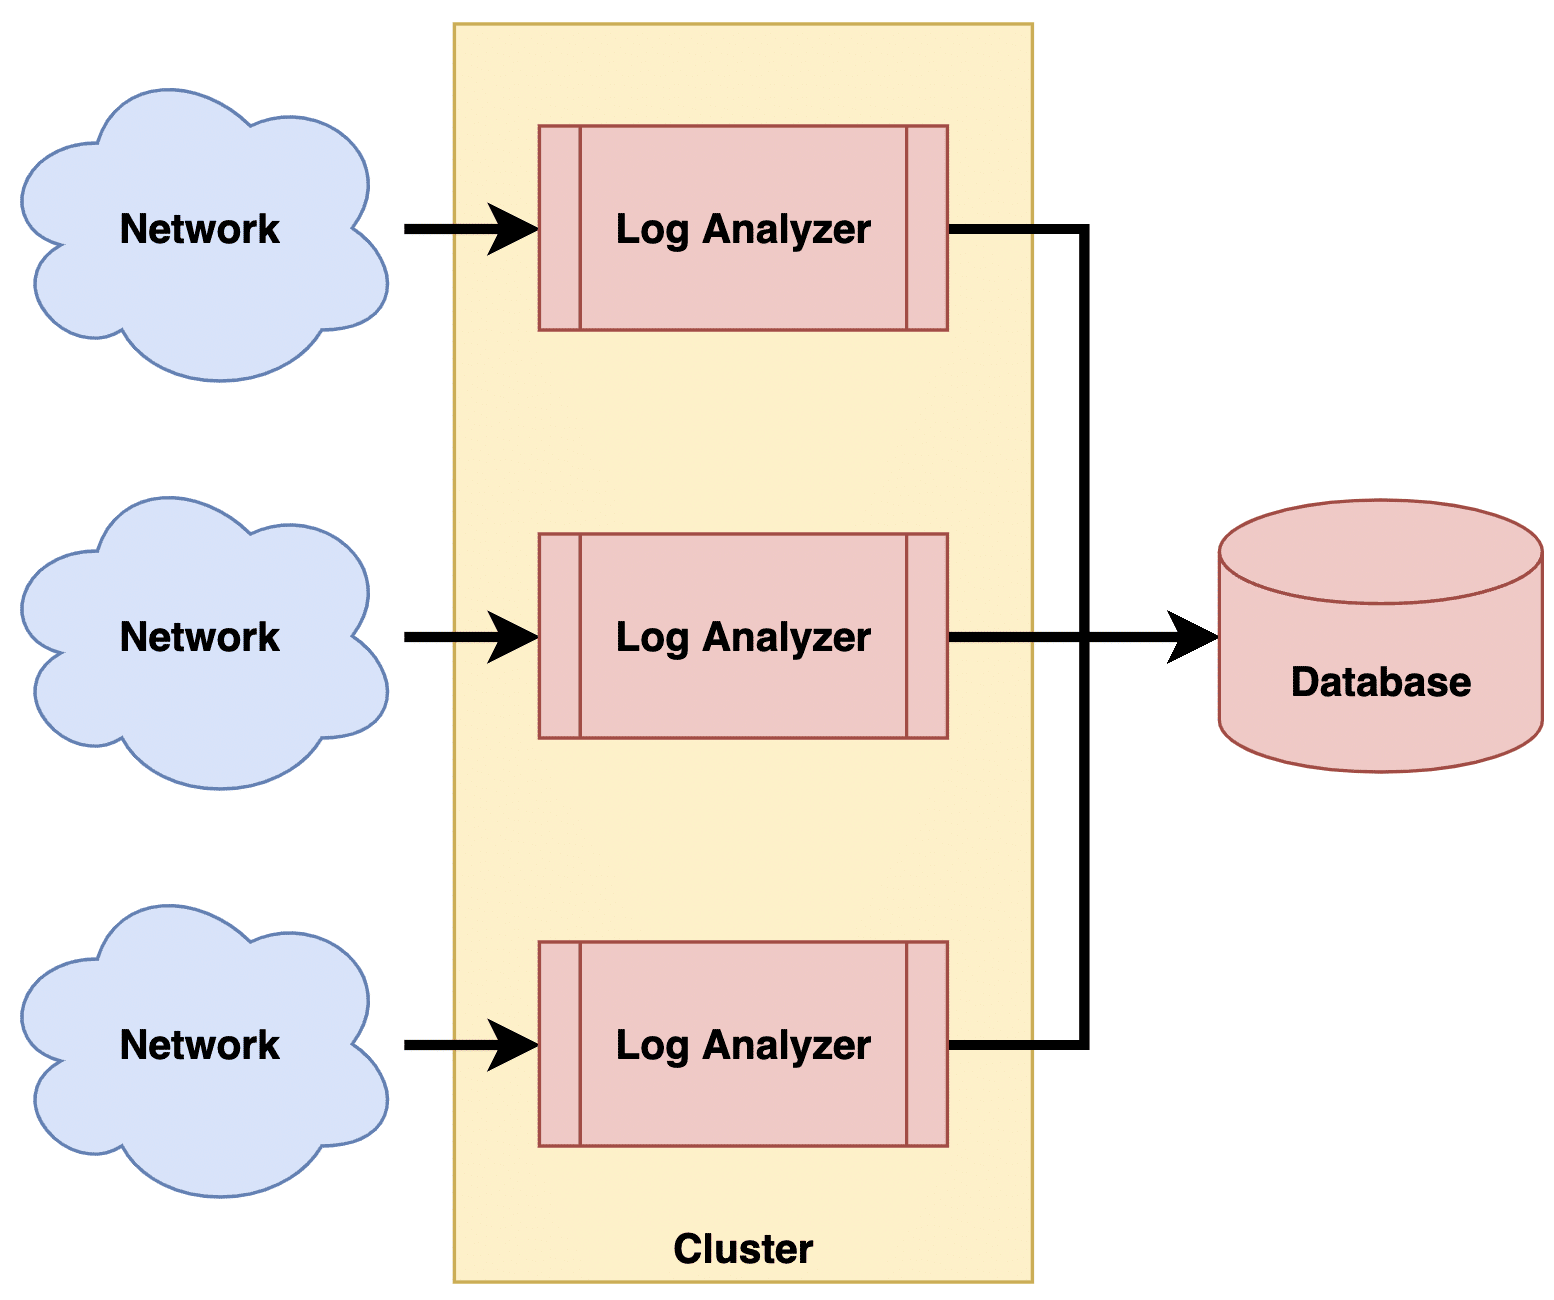
In this approach, the log analyser is replicated to form a cluster. The size of the cluster can be adjusted based on demand. Each instance of the log analyser handles logs from only a few devices, ensuring that the load on each log analyser remains manageable. Network administrators configure which devices send logs to which instances.
Additionally, log analysers can be deployed on the cloud with appropriate elasticity rules. This allows optimal hardware utilisation while smoothly scaling the cluster up or down to handle varying loads.
Looking at the current landscape, there are numerous log processing systems available in the market which follow such distributed design. Instead of building yet another log processing system, one could opt to acquire machine data analysers like Splunk for their needs.
Technology continues to evolve rapidly.


