


By harnessing the capabilities of logging and the Loki Operator within the s390x architecture, organisations can effectively manage, analyse, and derive actionable insights from log data. This two-part article series explains how this can be done.
Logging plays a pivotal role in modern software development, providing invaluable insights into the performance, health, and behaviour of applications and systems.As containerisation and microservices architectures become increasingly prevalent, efficient log management solutions are essential for maintaining operational excellence. Among these solutions, Prometheus and Loki stand out as robust tools for monitoring and log aggregation, respectively.
Let’s first explore the deployment of the logging operator in s390x architecture, along with various use cases and the deployment of a small application for cluster logs. In the next article in this two-part series we will shift our focus to deploying different applications, examining the dashboard view, and analysing the results.
Understanding logging and Loki Operator
Logging: Logging encompasses the process of capturing, storing, and analysing data generated by applications, servers, and infrastructure components. It serves as a critical tool for troubleshooting, performance monitoring, and security analysis.
Loki Operator: Loki Operator is a Kubernetes operator specifically designed to simplify the deployment and management of Loki. By automating the configuration, scaling, and maintenance of log aggregation infrastructure, Loki Operator streamlines operational workflows within Kubernetes environments.
Logging architecture overview
Logging within the OpenShift Container Platform involves several key components, each playing a crucial role in collecting, storing, and visualising log data. Figure 1 illustrates the architectural diagram.
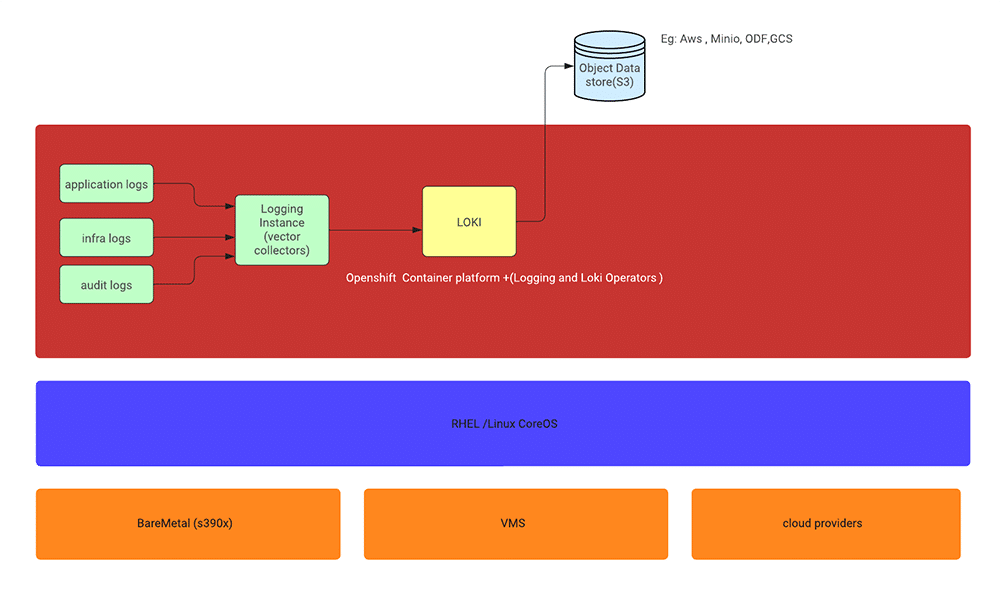
Collector: The collector, deployed as a daemon set, resides on each OpenShift Container Platform node. It is responsible for gathering log data from various sources, transforming it as necessary, and forwarding it to specified outputs.
There are two options for the collector: the Vector collector or the legacy Fluentd collector. However, Fluentd is deprecated and slated for removal in future releases. Red Hat encourages transitioning to Vector as an alternative.
Log store: The log store serves as the repository for storing log data, facilitating analysis and retrieval. It is the default output destination for the log forwarder.
OpenShift provides options for the log store, including the default LokiStack log store or the legacy Elasticsearch log store. Additionally, logs can be forwarded to external log stores as needed.
The OpenShift Elasticsearch Operator is deprecated and will be phased out in future releases. Red Hat recommends using the Loki Operator as an alternative for managing the default log storage.
Visualisation: Visualisation components enable users to view log data in a graphical format, facilitating search, query, and analysis. The UI component, typically accessed through the OpenShift Container Platform web console, provides an intuitive interface for log exploration.
Steps to deploy logging on OpenShift
To start the installation process, access the web console and navigate to Operators -> Operator Hub. Figure 2 illustrates the available RedHat OpenShift logging operators in the Operator Hub.
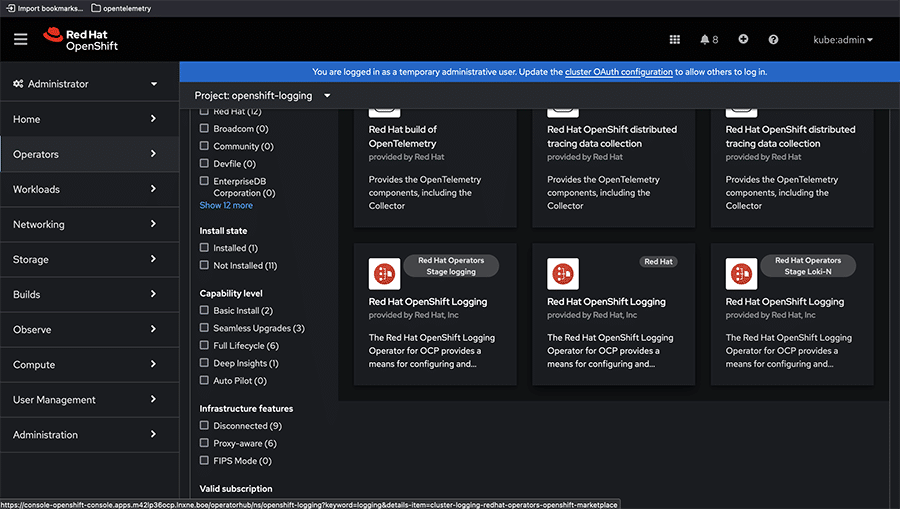
Select ‘Red Hat Openshift Logging’ from the list of operators provided and proceed by clicking ‘Install’ to initiate the installation.
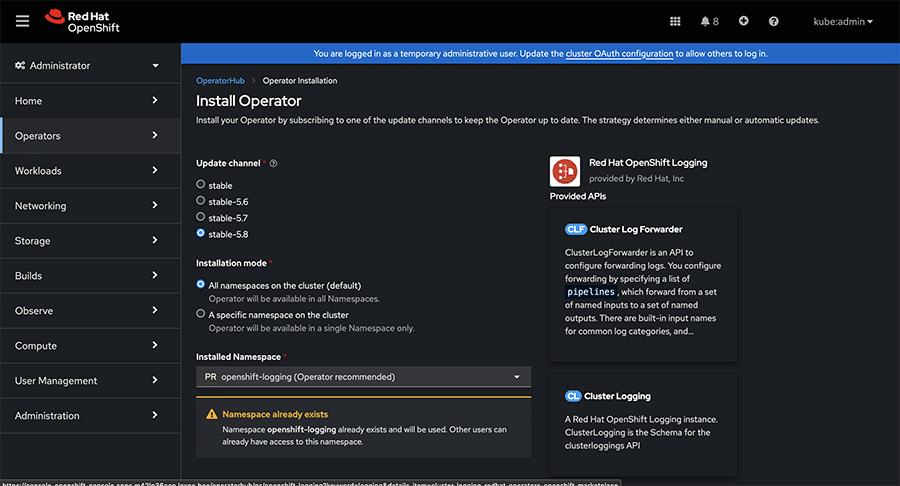
While installing, ensure that the recommended namespace for the operator is ‘openshift-logging’ within the installed namespace.
Additionally, set the update channel for the operator to ‘Stable’. You have the option to choose between the ‘Automatic’ or ‘Manual’ approval strategy.
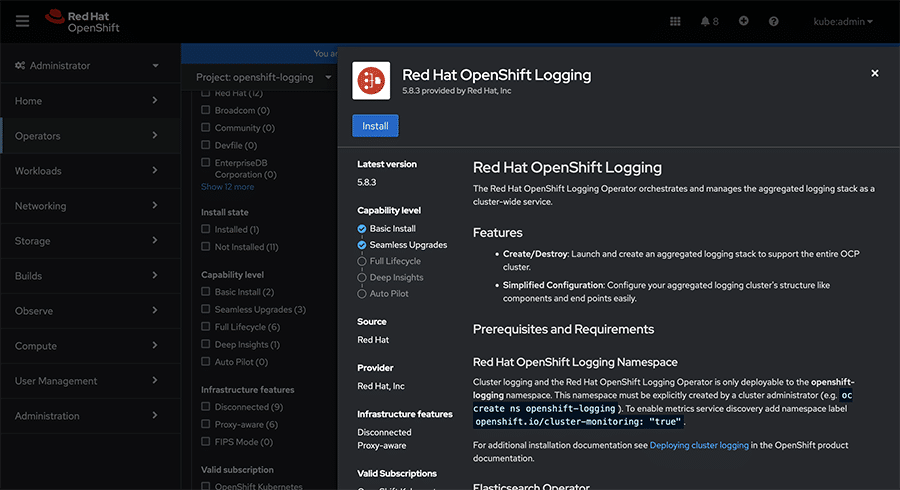
With the automatic option, OLM (operator lifecycle manager) will handle updates automatically when newer versions are available. Alternatively, manual approval requires user intervention for updates. Figure 3 offers a preview of the operator with the Install option.
Click on ‘Install’ to commence the installation process. Figure 4 displays all the necessary channels for installation.
After installation, verify the successful installation of the logging operator. Figure 5 shows the installation process is successfully completed.

Types of logs
Logging within the OpenShift Container Platform categorises logs into three main types.
Application logs: Generated by user applications running within the cluster, excluding infrastructure container applications.
Infrastructure logs: Include container logs from infrastructure namespaces such as OpenShift, kube, or default, as well as journald messages from nodes.
Audit logs: These are logs generated by auditd, the node audit system, along with logs from services such as kube-apiserver, openshift-apiserver, and ovn project if enabled.
Steps to deploy LokiStack on OpenShift
To successfully deploy a running LokiStack on OpenShift, follow these three essential steps.
- Install the Loki Operator from the OpenShift console. Begin by navigating to the ‘Operators’ section and accessing the ‘Operator Hub’. Search for the Loki Operator and proceed with the installation process.
- Create an object storage by generating a secret. This secret can be configured for various object storage providers such as AWS, GCP, or Minio. Ensure the secret is correctly configured to enable Loki to store logs securely.
- Create the custom resource (CR) for the LokiStack. This involves defining the specifications for your Loki deployment, including configurations for storage, retention, and other parameters.
For internal Loki log storage, the following steps outline the installation process:
- Ensure you have admin permissions and access to the OpenShift console URL.
- In the web console, navigate to Operators -> Operator Hub, as depicted in Figure 6.
- Search for the keyword ‘loki’ to locate the Loki Operator.
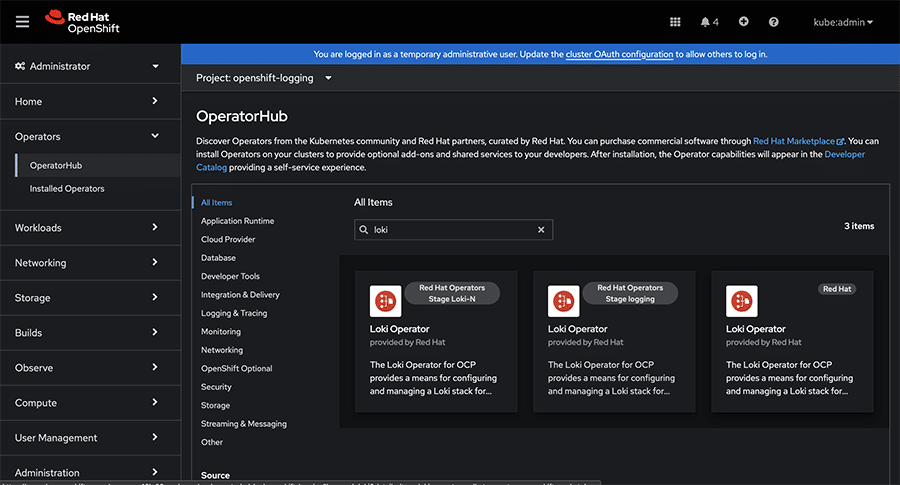
Proceed with the installation by following the prompts and providing necessary configurations as per your requirements.
When selecting a version for deployment, opt for the ‘stable’ option or any stable version 5.x among the available choices.
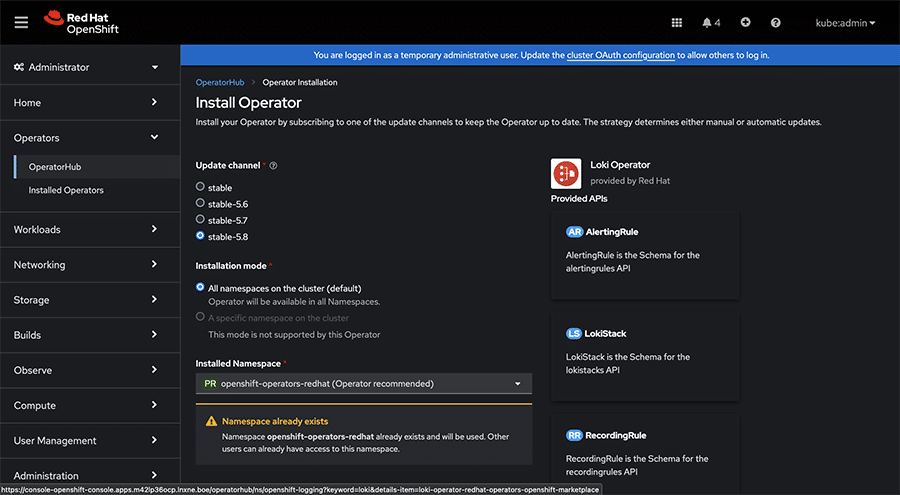
Ensure that the operator deployment is targeted towards the openshift-operators-redhat namespace, which is typically the default selection.
To streamline operations, it is advisable to choose the ‘Automatic’ approval strategy.
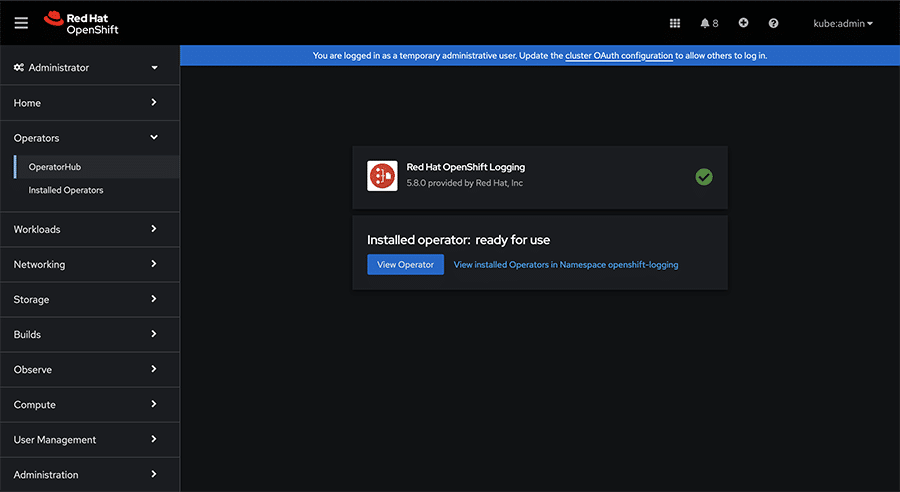
Once the operator is successfully installed, it should appear in the ‘Installed Operators’ section, as shown in Figure 8.
Now, it’s time to define the object storage for Loki, which can be AWS, Minio, GCP, or similar. To configure Loki’s object storage, you›ll need to create a secret. This can be done via the OpenShift Container Platform web console or by directly applying the YAML configuration.
Ensure to modify the ‘access_key_id’ and ‘access_key_secret’ fields with your credentials. Additionally, customise the ‹bucketnames›, ‘endpoint’, and ‘region’ fields to specify the object storage location.
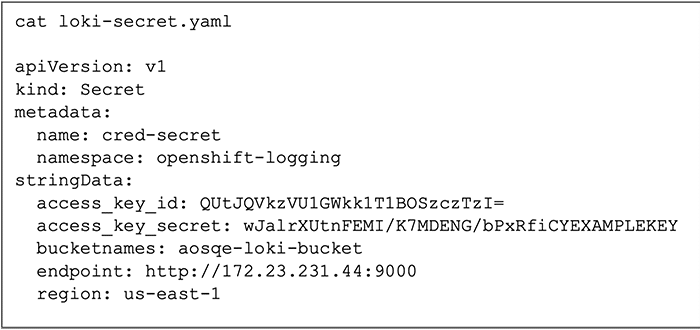
Figure 9 depicts an example configuration tailored for Minio. After customising the configuration to match your environment, create the secret within the ‘openshift-logging’ namespace.
Now, proceed to create the custom resource by applying the provided YAML file as depicted in Figure 10, ensuring the necessary modifications tailored to your cluster’s requirements.
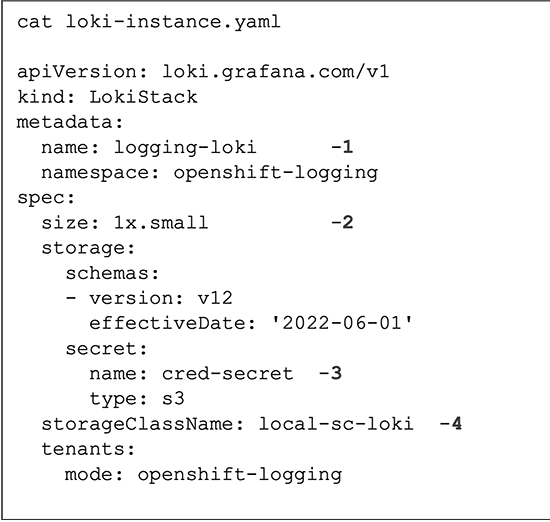
In the provided YAML file, make the following edits according to your cluster’s specifications:
- Specify a unique name for the LokiStack.
- Choose one of the available Loki deployment types: 1x.demo, 1x.extra-small, 1x.small, or 1x.medium, based on your cluster requirements.
- Provide the appropriate name for your storage class, suitable for temporary storage. For optimal performance, select a storage class that offers block storage.
You can view the available storage classes using the ‘oc get sc’ command.
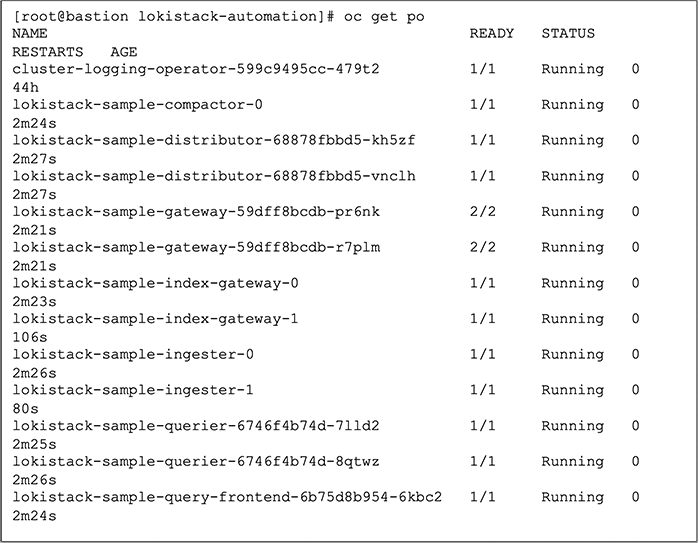
Once LokiStack is deployed, you should observe the pods running successfully, as illustrated in Figure 11.
Deploying the logging instance with LokiStack as the log store
To utilise LokiStack as the log store, you can create a cluster logging instance and specify LokiStack as the desired log storage option. Figure 12 depicts an example YAML configuration for a cluster logging instance.
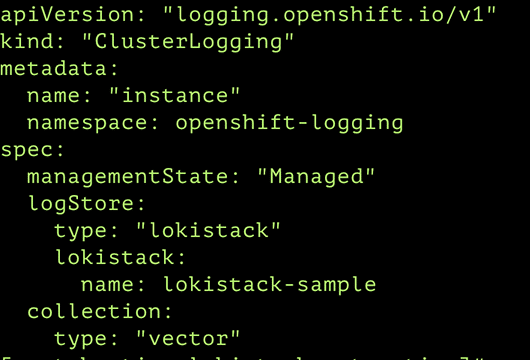
In the configuration, ensure to specify LokiStack as the log store type, along with the name of your LokiStack instance. Apply the configuration using the following command:
oc apply -f <cluster-logging-instance.yaml>
Upon successful application of the configuration, you can verify the deployment by checking that the collector pods are running as expected in Figure 13.

Deploying and monitoring application logs with the logging operator
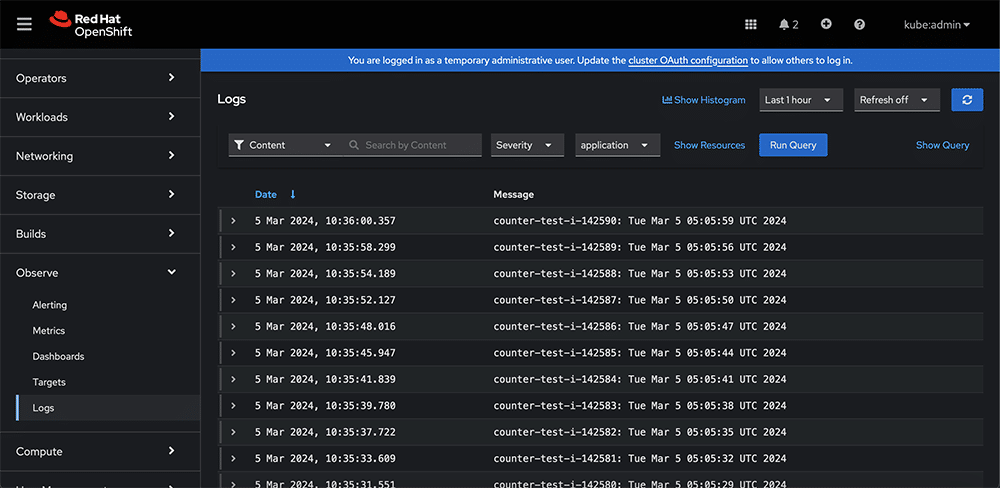
The application we deployed is a simple BusyBox container, generating a series of counter logs. Once the application is deployed, navigate to the ‘Operators’ section and select the logging operator. There, you’ll find an option to enable the console plugin. Make sure to enable it. Now, head over to the ‘Observe’ section on the console. Click on the ‘Logs’ option, and you’ll be able to view the logs as described above. In Figure 14, we can see the application logs in the dashboard.
Use cases
Centralised logging
Scenario: An organisation manages a distributed system comprising numerous microservices deployed on s390x architecture. To streamline troubleshooting and monitoring efforts, it opts to centralise log data from disparate sources.
Solution: By deploying Loki on Kubernetes using the Loki Operator, the organisation establishes a centralised log aggregation platform. This enables it to efficiently collect, store, and analyse logs from diverse microservices, facilitating comprehensive monitoring and troubleshooting.
Monitoring Kubernetes clusters
Scenario: A company operates multiple Kubernetes clusters on s390x infrastructure, each hosting critical workloads. It seeks a robust log management solution capable of providing real-time insights into cluster health and performance.
Solution: Leveraging Loki Operator, the organisation deploys Loki alongside Prometheus for comprehensive cluster monitoring. With Loki’s log aggregation capabilities, it gains visibility into cluster-wide events, resource utilisation trends, and application behaviour, empowering proactive management and optimisation of Kubernetes clusters.
Troubleshooting and debugging
Scenario: Members of a development team encounter intermittent errors within their application running on s390x architecture, hindering productivity and user experience. They require an efficient mechanism for identifying and resolving issues in real-time.
Solution: By integrating Loki into their logging infrastructure, the team members gain access to a powerful query language and dynamic log indexing capabilities. This enables them to conduct targeted searches, filter logs based on specific criteria, and correlate events across distributed systems, expediting troubleshooting and debugging processes.
Alerting and notification
Scenario: An e-commerce platform operating on s390x infrastructure experiences periodic spikes in traffic, potentially signalling performance degradation or service interruptions. The operations team aims to implement proactive alerting mechanisms to mitigate potential issues.
Solution: Utilising Prometheus and Grafana in conjunction with Loki, the organisation establishes comprehensive alerting rules based on log analysis and performance metrics. This allows the team to receive timely notifications regarding abnormal patterns, resource exhaustion, or system anomalies, facilitating prompt intervention and service restoration.
Whether centralising logs for streamlined monitoring, troubleshooting application issues, or enhancing security posture, Loki serves as a versatile tool for addressing diverse operational challenges. Organisations must try and unlock the full potential of Loki to elevate their log management practices to new heights of efficiency and effectiveness.
As stated at the beginning, the subsequent segment of this article series will involve deploying various applications and analysing logging outcomes within the dashboard.


