


A software may require a new update or release due to certain capability improvements or bug fixes. In the final part of this two-part series of articles, we will look at the solution proposed for the problem defined in the first article published in the April 2024 issue of OSFY.
In the first article in this series, we have already discussed category weightage (CWT), category value (CV) and category change percentage (CCP). Let us proceed further.
Feature effectiveness measure (FEM)
This critical indicator is used to assess the overall effectiveness of a software feature by considering the weighted averages of its performance across all four major categories, namely daily active users (DAU), session duration (SD), conversion rate (CR), and customer lifetime value (CLV). It provides a holistic view of how well the feature is performing based on a combination of these essential categories. The FEM serves as a key benchmark for evaluating the feature’s success over a defined time frame.
- Monthly FEM (MFEM): The monthly FEM is a variation of the feature effectiveness measure calculated at the end of every month. MFEM considers the category monthly change (CMC), which represents the monthly percentage change in the effectiveness of the feature’s categories. To calculate MFEM, the CMC is multiplied by the respective category weightage (CWT) and then divided by the sum of CWTs for all four categories — DAU, SD, CR, and CLV. This calculation results in a single numerical value that indicates the feature’s overall effectiveness for that month. For instance, if your feature’s DAU, SD, CR, and CLV categories have distinct changes in a given month, MFEM provides an aggregated measure that considers these changes in relation to their individual importance (CWT) for the feature.
![]()
- Quarterly FEM (QFEM): The quarterly FEM is a broader evaluation metric that is calculated at the end of every quarter. It offers a more extensive perspective on the feature’s effectiveness by considering the monthly FEM values over the three months of a quarter (M1 MFEM, M2 MFEM, and M3 MFEM). The QFEM is derived by summing these monthly FEM values and then dividing the result by three to calculate the quarterly average. For example, if you want to assess the feature’s performance over an entire quarter, QFEM provides a summary value based on the changes observed in the monthly FEM values. This quarterly measure is especially useful for longer-term performance evaluation.
![]()
Feature standard deviation (FSD)
This statistical measure quantifies the level of variation or fluctuation in the FEM across all the data points. It serves as an important metric to assess how consistent or stable the feature’s performance has been over a specific period. A small standard deviation indicates that the effectiveness of the feature remains relatively stable and exhibits less variation over the determined range, which is often considered desirable. In contrast, a large standard deviation suggests that the effectiveness of the feature is highly volatile, which may not be preferable as it can lead to inconsistent outcomes. The calculation of FSD can be conducted over various timeframes, with a common practice being to calculate it over all the data points collected during a period of one year. However, this calculation can be extended to larger datasets for more comprehensive insights.
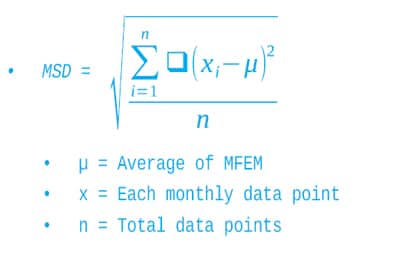
- Monthly standard deviation (MSD): This denotes a variation of the feature standard deviation specifically calculated at the end of every month. It quantifies the amount of variation or fluctuation in the monthly feature effectiveness measure (MFEM) values over a series of months. MSD offers insights into how consistent or variable the feature’s effectiveness has been monthly. To calculate MSD, the formula involves finding the square root of the sum of squared differences between each monthly MFEM data point (x) and the average of the monthly MFEM values (µ). This value is then divided by the total number of data points (n) to obtain the monthly standard deviation.
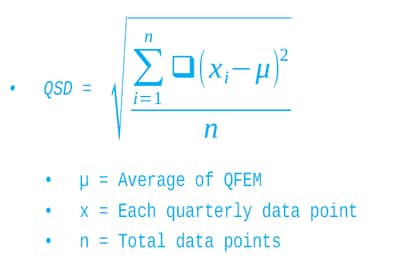
- Quarterly standard deviation (QSD): This is designed to measure the variation in the FEM over a broader timeframe, specifically at the end of every quarter. It provides a more comprehensive perspective on the feature’s stability or variability by considering the monthly FEM values over the three months of a quarter. The formula for calculating QSD is akin to MSD, involving the square root of the sum of squared differences between each quarterly FEM data point (x) and the average of the quarterly FEM values (µ). The result is divided by the total number of data points (n) to obtain the quarterly standard deviation.
Feature absolute deviation (FAD)
This statistical measure quantifies the extent to which the FEM values deviate from the mean. It provides insights into how much the effectiveness of a feature varies from the average value. A small absolute deviation indicates that the effectiveness of the feature remains relatively close to the mean over the determined range, which is often considered desirable. Conversely, a large absolute deviation suggests that the effectiveness is deviating significantly from the mean, which might not be preferable as it can lead to inconsistent outcomes. FAD is a valuable metric to assess the degree of fluctuation in the effectiveness of a feature over a specific period. It is particularly useful for understanding the consistency and stability of the feature’s performance.
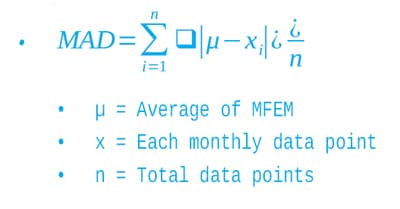
- Monthly absolute deviation (MAD): This denotes a variation of the feature absolute deviation calculated at the end of every month. It quantifies the amount of variation in the monthly feature effectiveness measure (MFEM) values from the mean. MAD is instrumental in assessing the monthly variability of the feature’s effectiveness. To calculate MAD, the formula involves finding the absolute difference between each monthly MFEM data point (x) and the average of the monthly MFEM values (µ). The absolute differences are summed and divided by the total number of data points (n) to obtain the monthly absolute deviation.
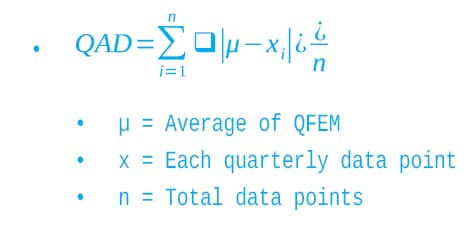
- Quarterly absolute deviation (QAD): This is designed to measure the variation in the FEM over a broader timeframe, specifically at the end of every quarter. It provides a more comprehensive perspective on the feature’s stability or variability by considering the quarterly FEM values over the three months of a quarter. The formula for calculating QAD is similar to MAD, involving the absolute difference between each quarterly FEM data point (x) and the average of the quarterly FEM values (µ). The absolute differences are summed and divided by the total number of data points (n) to obtain the quarterly absolute deviation.
Defining the feature constants
The growth constant (GC) and deviation constant (DC) are critical numerical parameters in the context of measuring and assessing the effectiveness of software features. These constants play a pivotal role in the calculation of the feature effectiveness indicator (FEI) and help establish expectations for feature performance. Here’s an expanded explanation of these constants.
Growth constant (GC)
The growth constant, denoted as GC, is a fixed numerical value that serves as a fundamental parameter in evaluating the anticipated rate of growth or change in the context of software feature effectiveness. It is a mathematical representation of how rapidly a specific metric or quantity associated with a feature is expected to either increase or decrease over a defined period. In practical terms, GC can be thought of as a projection or expectation regarding the feature’s performance improvement. For example, if a feature has a GC of 10%, this means that it is expected to exhibit a growth rate of 10% over a specified timeframe. In other words, the feature’s effectiveness should ideally increase by 10% during that period. This growth rate can be a key reference point for assessing whether the feature is performing as expected and meeting the predetermined growth objectives.
Deviation constant (DC)
The deviation constant, denoted as DC, is another fixed numerical value used in the context of software feature evaluation. Unlike GC, which focuses on growth or change, DC pertains to the expected rate of deviation or variation within certain boundaries. It provides insight into the tolerance for fluctuations or deviations in the effectiveness of a feature. For instance, if a feature has a DC of 10%, this indicates that its performance can reasonably deviate by up to 10% from standard or expected calculations without raising significant concerns. In essence, DC helps set acceptable limits for variations in the feature’s performance.
Both GC and DC should be thoughtfully determined to align with the project’s goals, and they play a crucial role in calculating the feature effectiveness indicator (FEI), which is central to measuring feature effectiveness. These constants are not arbitrary values but are derived based on the unique business context and the nature of the feature in question. For example, a project aimed at rapid growth and innovation may have a higher GC to reflect aggressive growth targets, while a project focused on stability and risk mitigation may have a lower GC and a narrower range for DC to minimise performance variations.
Calculating the feature effectiveness indicator (FEI)
Feature effectiveness indicator (FEI)
FEI is a pivotal metric in the realm of software feature evaluation, serving as a singular and comprehensive indicator of the effectiveness of deployed user features in a production environment. FEI encapsulates a range of quantitative data to provide a holistic view of how well a software feature is performing within the production environment. It consolidates various performance indicators, such as category weightage, feature effectiveness measure (FEM), as well as absolute and standard deviation that represent user engagement and satisfaction. The FEI is designed to offer a clear and actionable assessment of whether a feature is meeting its intended objectives and aligning with project goals.
Comparison between FSD and FAD
The choice between feature standard deviation (FSD) and feature absolute deviation (FAD) depends on your specific analytical needs and the characteristics of your data. Use FSD when you want to measure the level of variation or fluctuation in a feature’s performance. FSD provides insights into the consistency and stability of the feature’s effectiveness over time and is particularly useful when you want to assess how stable the feature’s performance has been and whether it exhibits less variation, which is often considered desirable. Use FAD when you want to measure how much the feature’s effectiveness values deviate from the mean or average value. FAD quantifies the extent to which the feature’s effectiveness varies from the average and it’s useful for understanding the degree of fluctuation in the feature’s performance and how much it deviates from the mean.
In summary, if you’re more interested in assessing the variation and stability of a feature’s performance, FSD is a suitable choice. On the other hand, if you want to focus on how much the feature’s effectiveness deviates from the average and understand the consistency of its performance, FAD is the metric to use. Your choice should align with your specific analysis goals and the type of insights you aim to gain.
Calculation frequency
FEI is a recurring and dynamic assessment that can be calculated at two specific intervals — at the end of every month and invariably at the end of every quarter. This regular evaluation allows for ongoing monitoring of feature performance and helps identify trends and patterns over time. Monthly assessments provide a more granular view, while quarterly evaluations offer a broader perspective on feature effectiveness.
Levels of FEI
The FEI uses a simple, straightforward and intuitive ‘green’ and ‘red’ scale to classify feature effectiveness, providing a quick and user-friendly visual reference for decision-makers.
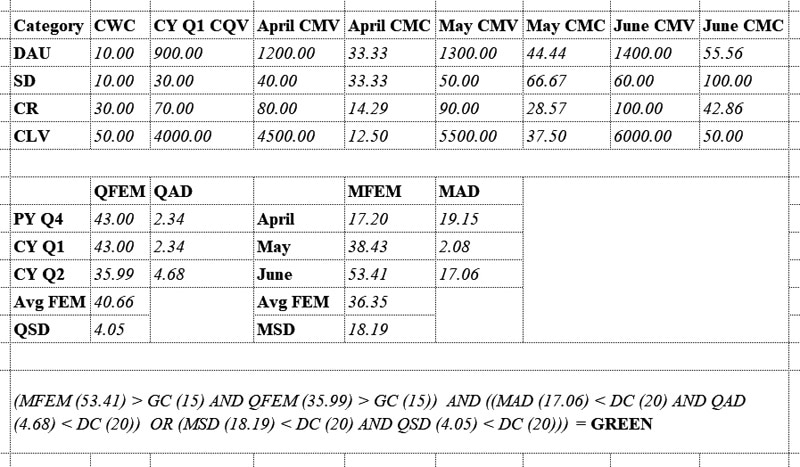
Green FEI: When a feature attains a green FEI status, it signifies that the feature is performing optimally and effectively. This level indicates that the feature is achieving or surpassing its predefined growth and deviation expectations. In essence, a green FEI reflects a positive trend and successful performance. Features falling under this category are meeting user needs and contributing positively to the project.
![]()
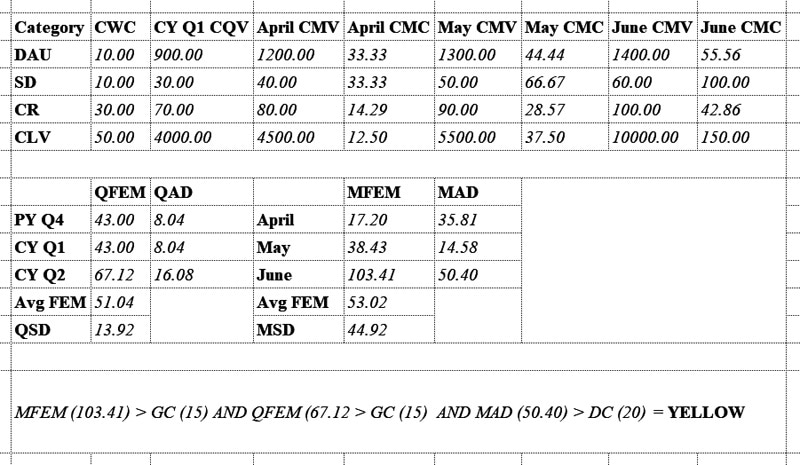
Yellow FEI: A yellow FEI suggests that a feature’s performance is acceptable but there is room for improvement. It may indicate that the feature is progressing well, but there are deviations well above the predefined expectations. While not in a crisis, features with a yellow FEI may benefit from further optimisation to ensure they reach their full potential.
![]()
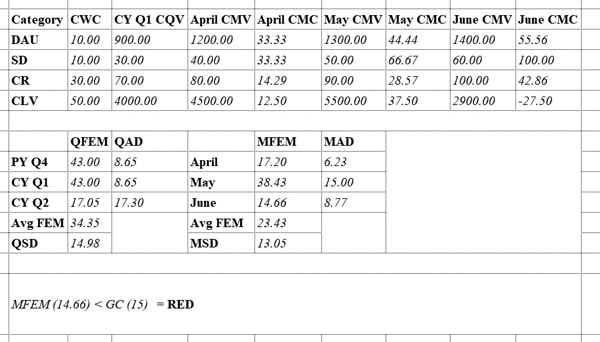
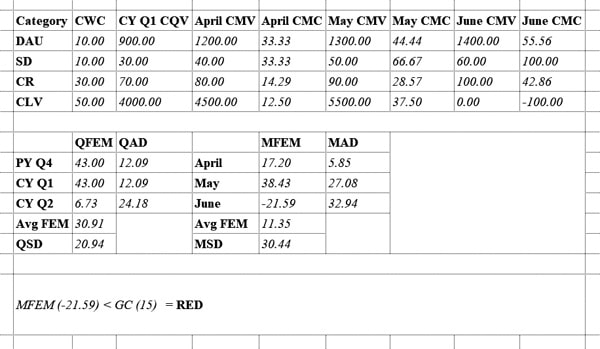
Red FEI: A red FEI is a warning sign that a feature is not performing as expected. It indicates that the feature’s performance is falling short of predefined growth and deviation standards. Features categorised as ‘red’ require immediate attention, investigation, and action. This status prompts stakeholders to address issues, gather user feedback, and make necessary improvements to align the feature with its goals.
![]()
Explanation with examples
Here are the assumptions and deviations:
- CY = Current year | PY = Previous year
- CY Q1 = January, February, March | CY Q2 = April, May, June
- For the ease of understanding, across all the examples:
- GC = 15
- DC = 20
- June CLV CMV changes and all other input metrics remain constant.
- Both FSD and FAD are considered as deviations
- Calculation happens at the end of CY Q2 June.
Feedback loop
After implementing features, the key step is to act on FEI results in the feature management system, making informed decisions based on insights gathered during the feature life cycle. Ongoing optimisation, often involving multiple iterations, ensures software features meet user and business objectives. If a deployed user feature has a red FEI, a systematic approach is vital to understand issues, make improvements, and optimise the effectiveness. Consider the following steps in this situation:
- Pinpoint where the feature is falling short. Is it not meeting user needs or failing to drive desired user actions?
- Gather user feedback and conduct usability testing to gain insights into the areas for improvement.
- Evaluate how similar features from competitors are performing.
- Based on the analysis, prioritise the most critical areas for improvement considering the impact on user satisfaction, business goals, and technical feasibility.
- Iteratively implement feature enhancements based on the identified issues and priorities.
- Conduct A/B testing to compare the performance of different variations of the feature.
- Keep users informed about the updates to the feature and provide training as required
- Continuously monitor the FEI after making the changes, and measure the impact of improvements using the same KPIs.
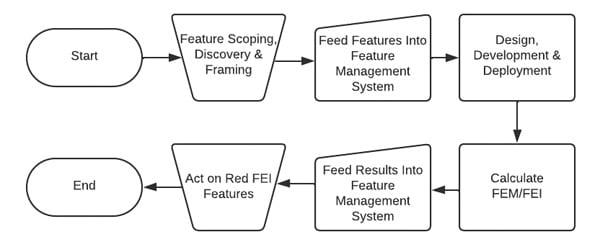
The software feature journey, from inception to deployment, is complex and relies on feature evaluation, as demonstrated above, for successful software development and product management. This critical practice addresses common challenges, preventing the far-reaching consequences of delivering ineffective features. The feature effectiveness measure (FEM) and feature effectiveness indicator (FEI) play vital roles, with FEM providing a calculated metric and FEI serving as the singular indicator categorised as green, yellow, or red. Acting on red FEI involves a systematic approach, including user feedback, testing, prioritisation, iteration, and optimisation. In summary, feature evaluation is an ongoing practice crucial for software development success, allowing organisations to navigate challenges and deliver products meeting user expectations and driving business success.


