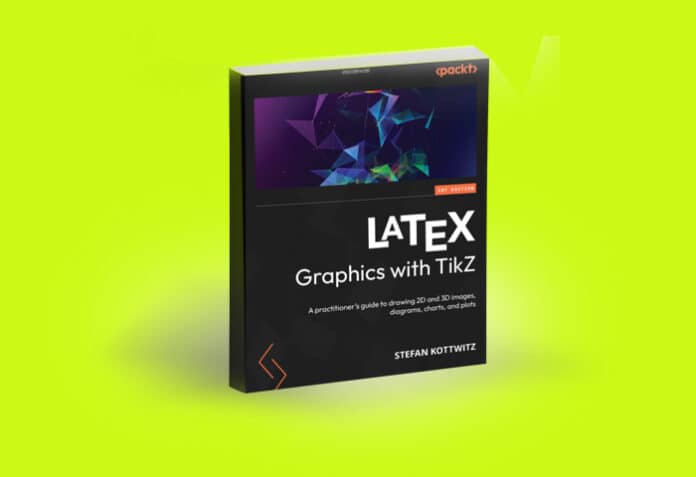
Published last year, this book introduces TikZ, a powerful, open source, computer graphics package. Those who use LaTeX to add figures, diagrams, plots or graphs to their documents will find it informative.
Quite some time ago, I found some templates online that helped one to create a very neat and coloured mind map. Unfortunately, after some months, I forgot what the name of this software was. There are thousands of useful tools in the world of free and open source software (FOSS). So I wondered how to find the tool I was looking for?
Sometime later, the answer suddenly popped up. It was TikZ. Hence, on seeing this 2023 book on the subject, I thought of checking it out. Then I thought of sharing the potential of this underrated software with anyone who may be interested.
Stefan Kottwitz, the author of this book, promises to give a “practical introduction to production graphics in LaTeX.” He does so, using TikZ, “a powerful modern computer graphics package.” Moreover, he promises that the book will help you write “mathematical, scientific, or technical papers with graphics.” “Learning TikZ is more than worth the effort,” he promises.
Does he succeed in the goal? As someone with an interest in layouts, the digital media and publishing, this book drew my attention.
Its inventor Till Tantau created TikZ as a set of TeX commands for drawing graphics. Tantau is German, studied maths, and works in network and IT security engineering for Lufthansa Industry Solutions.
The book has 15 chapters, ranging from the basics (‘Getting Started with Tikz’) to examples of the more complex results you can achieve. In case you were wondering, this language is meant to produce vector graphics from a geometric or algebraic description. ‘Having Fun with TikZ’ is one chapter. Another brief chapter gives pointers to ‘Other Books You May Enjoy’, and points to LaTeX titles.
LaTeX, as academic readers especially would know, is used to typeset documents. If you know how to manage it, it works quickly and neatly. LaTeX markup describes the content and layout of the document. It does not work on formatted text, as is done by WYSIWYG (what-you-see-is-what-you-get) word processors like Microsoft Word, LibreOffice Writer and Apple Pages. Because of its power and neatness, LaTeX is widely used to create and publish scientific documents.
Leslie Lamport wrote LaTeX in the early 1980s. Initially, it was a writing tool for mathematicians and computer scientists. Then scholars took it up to write documents with complex math expressions or non-Latin scripts, including Devanagari (see this document, dating back to 1991: https://sanskritlibrary.org/software/devanagari.pdf).
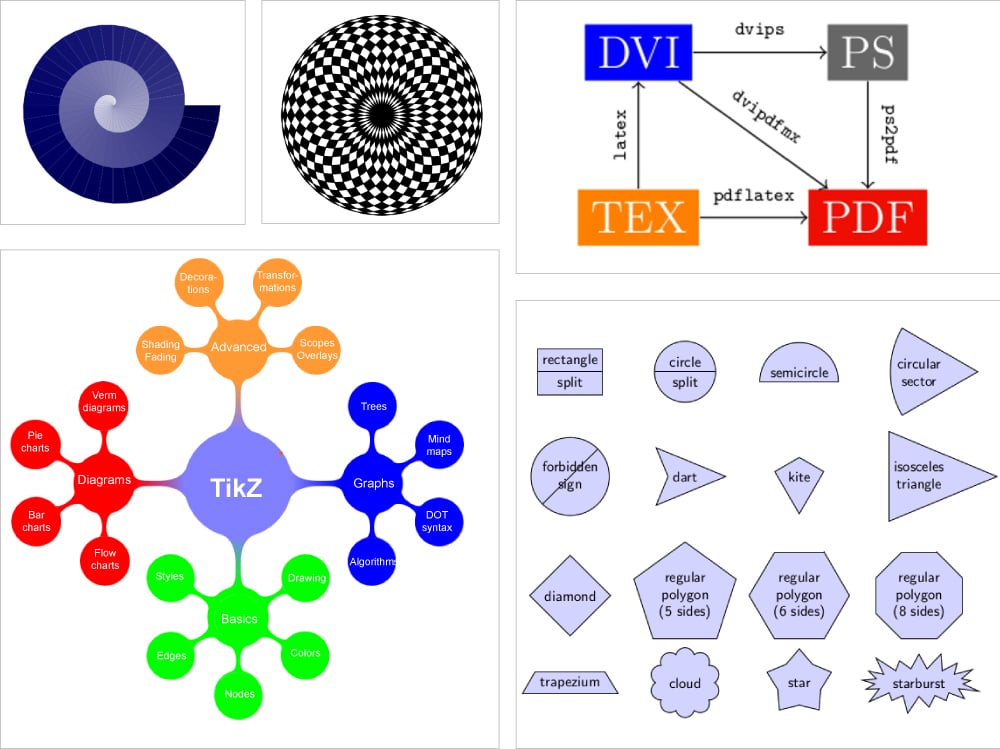
PGF and TikZ are a pair of languages for producing vector graphics, using geometric or algebraic descriptions to create technical illustrations and drawings. You can draw points, lines, arrows, paths, circles, ellipses and polygons. PGF is a lower-level language, while TikZ is a set of higher-level macros that use PGF.
TikZ’s name comes from the ‘TikZ ist kein Zeichenprogramm’ (German for ‘TikZ is not a drawing program’).
This book is for LaTeX users (in education, academia or industry) who need to add figures, diagrams, plots or graphs to their articles, theses, books or documents. You need to know a bit of LaTeX, or at least read a beginner’s book on it.
The introduction of this book (p.xiii-xv) promises to take you to understand graphics packages, TikZ’s benefits, and its philosophy. It also tells you how to install TikZ, create your first TikZ images from scratch, the concept of nodes, and more.
Here, things start to get detailed. You will also learn how to draw edges and arrows, use styles and pics, draw trees and graphs, shading, decorating paths and more. Some other concepts taught include layers, calculating coordinates and paths, drawing smooth curves, plotting in 2D and 3D, and drawing diagrams.
Kottwitz promises: “Furthermore, this book covers clipping, filling, shading, and adding decorations. You will learn about calculations with coordinates and transformations of coordinates and canvas. This book will help you create professional-looking diagrams and plots in two and three dimensions for visualising your ideas and data…. you can quickly start with TikZ and enjoy its many benefits.”
Topics you come across in this book come in a wide range — how to create objects ranging from angles to arcs, arrows, arrow tips, ball shading, background layers, bar charts, colour maps, flowcharts, loops, mind maps, pie charts, rectangles, ticks, and transparencies.
Believe it or not, this tool can also help create jigsaw puzzles.
To get the most out of this book, you need a TeX installation (either TeX live, MiKTeX, or MacTeX). If you don’t wish to install LaTeX, you can go to tikz.org. This has an online compiler. Besides, the helpful overleaf.com helps to compile examples that you get on GitHub or tikz.org.
You get the code to try out concepts, which can be downloaded from GitHub. You can even open the entire code bundle by opening it in overleaf.com.
Overleaf has been described as “a collaborative cloud-based LaTeX editor used for writing, editing and publishing scientific documents.” It is very simple and interesting to use — check it out online.
This book is written in a way that makes it easy to follow. Starting with small circles and simple objects, it takes you to some rather complex designs. Slowly, you begin realising what a powerful tool this could be.
If the reader is not too deep into design or publishing, he or she can just skim through, and zoom in on those sections that are of closer interest to one’s work. That should suffice, as the book also helps to work with snippets of code.
Some online links are helpful, like for accessing libraries from Cisco or Hewlett Packard (the hardware giants), which can be used in TikZ too.
FOSS tools are often seen as lacking good documentation. Books like this one fill a vital gap.


