


This article briefly explores the features of the Grand Unified Debugger, a debugging tool for Emacs.
If you are a C/C++ developer, it is highly likely that you have crossed paths with GDB (the GNU debugger) which is, without doubt, one of the most powerful and unrivalled debuggers out there. Its only drawback is that it is command line based, and though that offers a lot of power, it is sometimes a bit restrictive as well. This is why smart people started coming up with IDEs to integrate editors and debuggers, and give them a GUI. There are still developers who believe that using the mouse reduces productivity and that mouse-click based GUIs are temptations by the devil.
Since Emacs is one of the coolest text editors out there, I am going to show you how to write, compile and debug code without having to touch the mouse or move out of Emacs.
The Grand Unified Debugger, or GUD as it is commonly known, is an Emacs mode in which GDB can be run from within Emacs. This provides all the features of Emacs in GDB. The user does not have to move out of the editor to debug the code written.
Setting the stage for the Grand Unified Debugger
If you are using a Linux machine, then it is likely you will have GDB and gcc already installed. The next step is to ensure that Emacs is also installed. I am assuming that the readers are familiar with GDB and have used it at least for basic debugging. If not, please do check out some quick introductions to GDB that are widely available on the Internet.
For people who are new to Emacs, let me introduce you to some basic terminology. Throughout this article, you will see shortcut commands such as C-c, M-x, etc. C means the Ctrl key and M means the Alt key. C-c means the Ctrl + c keys are pressed. If you see C-c c, it means Ctrl + c is pressed followed by c. Also, in Emacs, the main area where you edit the text is called the main buffer, and the area at the bottom of the Emacs window, where commands are entered, is called the mini buffer.
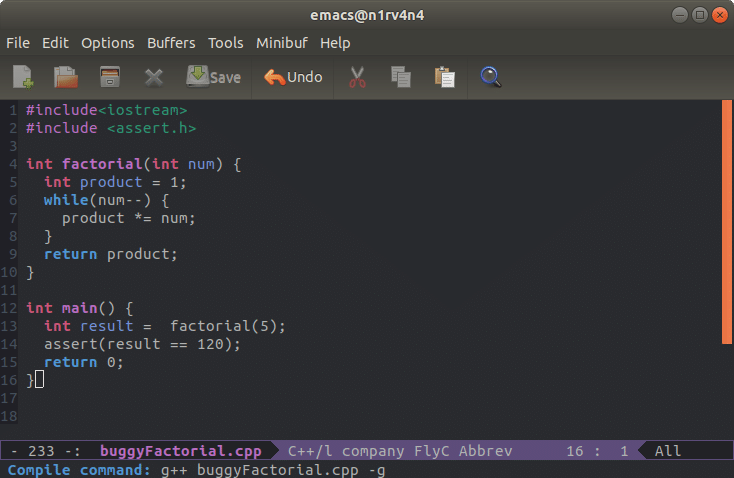
Start Emacs and to create a new file, press C-x C-f. This will prompt you to enter a file name. Let us call our file ‘buggyFactorial.cpp’. Once the file is open, type in the code shown below:
#include<iostream>
#include <assert.h>
int factorial(int num) {
int product = 1;
while(num--) {
product *= num;
}
return product;
}
int main() {
int result = factorial(5);
assert(result == 120);
}
Save the file with C-x C-s. Once the file is saved, it’s time to compile the code. Press M-x and in the prompt that comes up, type in compile and hit Enter. Then, in the prompt, replace whatever is there with g++ -g buggyFactorial.cpp and again hit Enter.
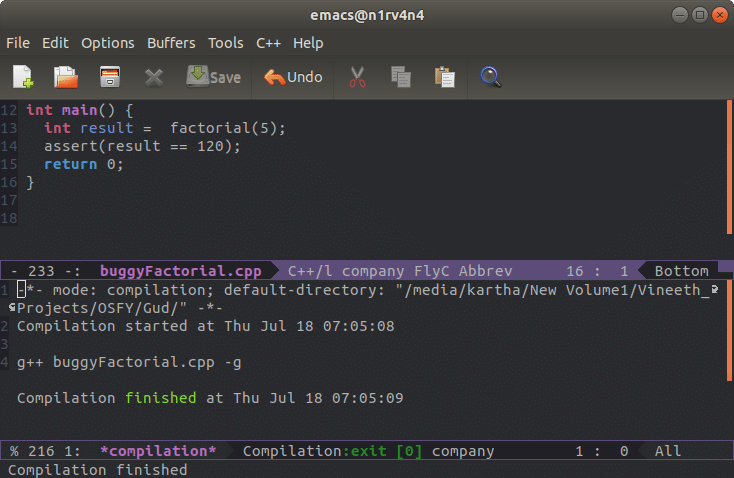
This will open up another buffer in Emacs that will show the status of the compile and, hopefully, if the code typed in is correct, you will get a buffer like the one shown in Figure 2.
To hide this compilation status buffer, make sure your cursor is in the compilation buffer (you can do this without the mouse using C-x o-this is used to move the cursor from one open buffer to the other), and then press C-x 0. The next step is to run the code and see if it works fine. Press M-! and in the mini buffer prompt, type ./a.out.
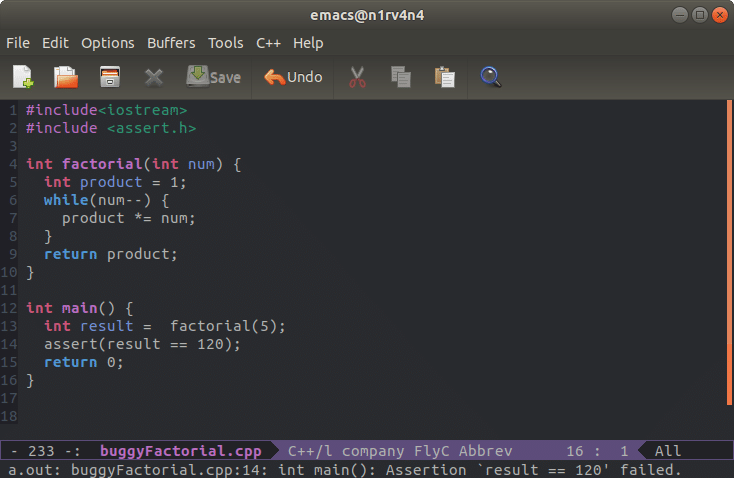
See the mini buffer that says the assertion is failed. Clearly, something is wrong with the code, because the factorial (5) is 120. So let’s debug the code now.
Debugging the code using GUD
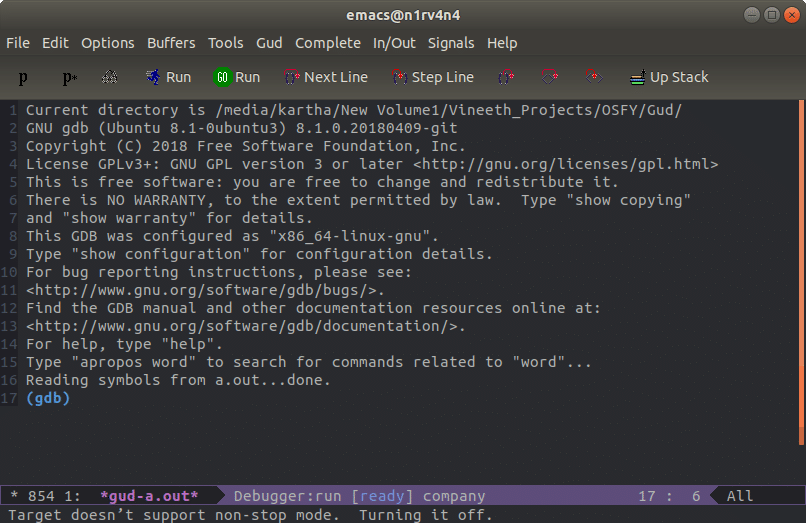
Now, since we have the code compiled, it’s time to see what is wrong with it. Press M-x and in the prompt, enter gdb. In the next prompt that appears, write gdb -i=mi a.out, which will start GDB in the Emacs buffer and if everything goes well, you should get the window that’s shown in Figure 4.
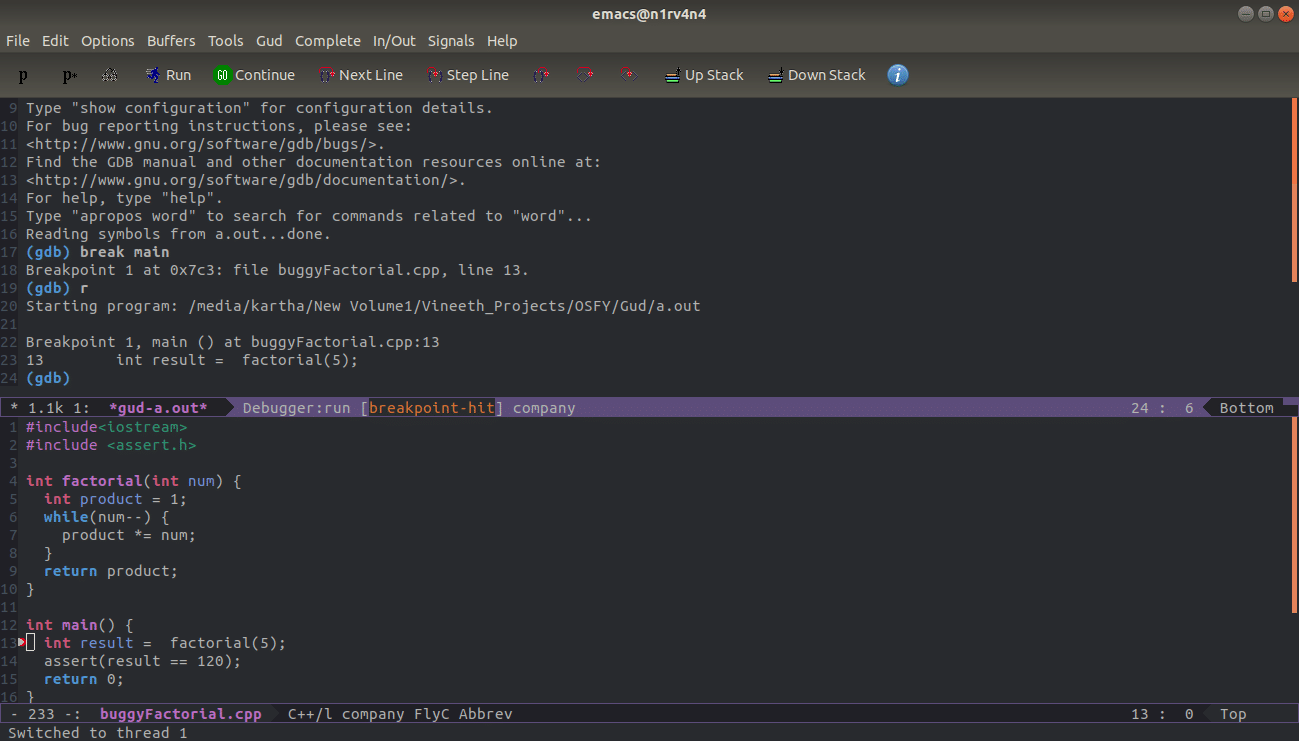
At the gdb prompt, type break main and then r to run the program. This should start running the program and should break at the main().
As soon as GDB hits the break point at main, a new buffer will open up showing the code that you are debugging. Notice the red dot on the left side, which is where your breakpoint was set. There will be a small indicator that shows which line of the code you are on. Currently, this will be the same as the break point itself (Figure 5).
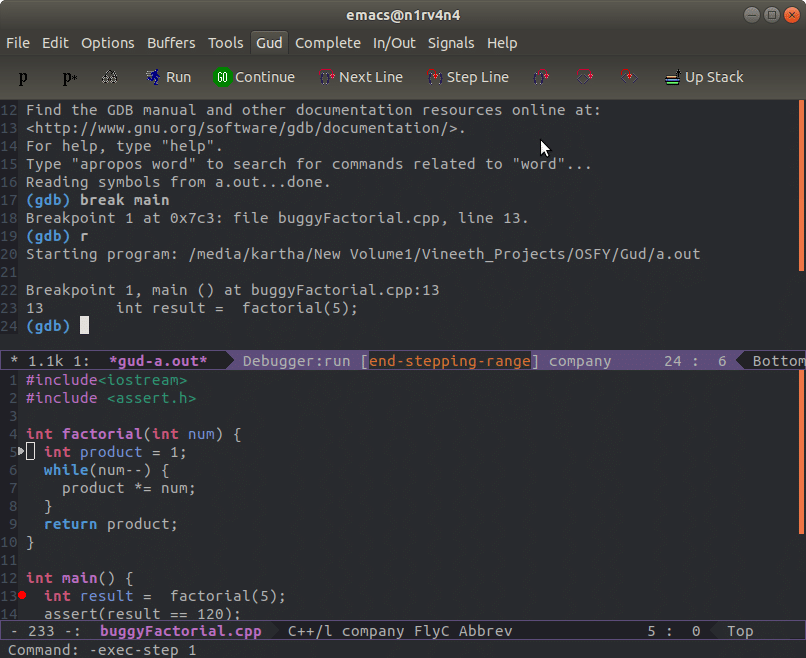
To debug the factorial function, we need to step into it. For this, you can either use the gdb prompt and the gdb command step, or you can use the Emacs shortcut C-c C-s. There are other similar shortcuts, but I prefer using the GDB commands. So I will use them in the rest of this article.
Let us keep an eye on the local variables while stepping through the factorial number. Check out Figure 6 for how to get an Emacs frame to show the local variables.
Step through the code in the GDB prompt and watch the value of the local variable change. In the first iteration of the loop itself, we see a problem. The value of the product should have been 5 and not 4.
This is where I leave you and now it’s up to the readers to explore and discover the magic land called GUD mode. Every gdb command works in the GUD mode as well. I leave the fix to this code as an exercise to readers. Explore and see how you can customise things to make your workflow simpler and become more productive while debugging.


