


This article is about understanding continuous integration and continuous delivery, which are pillars of the DevOps culture. Building quality software that meets the expectations of the client requires, among other things, constant monitoring and improvement in the code. This can be automated very efficiently through DevOps practices.
It is important to understand that continuous integration (CI) and continuous delivery (CD) come under the umbrella of the DevOps culture, which brings about effective communication and collaboration between the development and operations teams. Multiple continuous practices are implemented to adopt the DevOps culture. CI and CD are two of them. Continuous testing, continuous deployment, continuous monitoring, continuous notifications, Infrastructure as a Code and configuration management are some other practices organisations follow.
Continuous code inspection
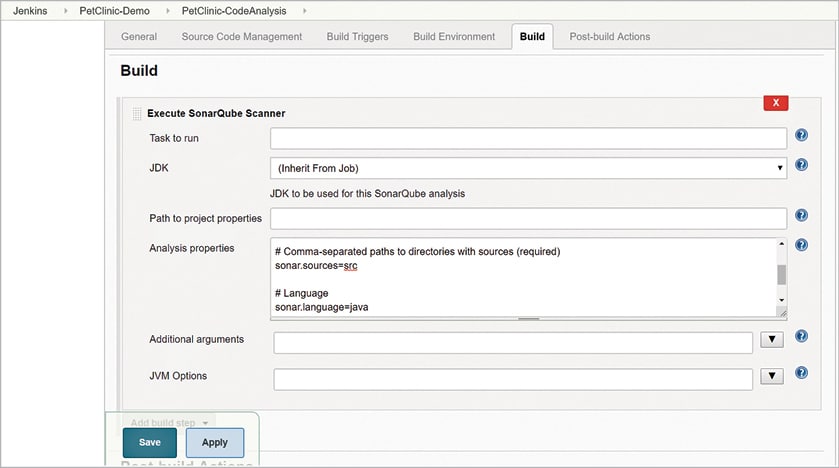
Continuous code inspection helps to improve the quality of code by checking the code against pre-defined rules. There are many open source and commercial tools available in the market for static and dynamic code analysis. As an example, in Figure 1, SonarQube is integrated with one of the most popular automation servers – Jenkins.
Given below is the console log of SonarQube execution:
Started by user admin Building in workspace F:\1.DevOps\2018\JenkinsHomeTemplate\sharedspace No credentials specified > git.exe rev-parse --is-inside-work-tree # timeout=10 Fetching changes from the remote Git repository > git.exe config remote.origin.url https://github.com/mitesh51/spring-petclinic.git # timeout=10 Fetching upstream changes from https://github.com/mitesh51/spring-petclinic.git > git.exe --version # timeout=10 > git.exe fetch --tags --force --progress https://github.com/mitesh51/spring-petclinic.git +refs/heads/*:refs/remotes/origin/* > git.exe rev-parse “refs/remotes/origin/master^{commit}” # timeout=10 > git.exe rev-parse “refs/remotes/origin/origin/master^{commit}” # timeout=10 Checking out Revision 9500fe4d7c1012a475b719dcab2f71d9242ddc40 (refs/remotes/origin/master) > git.exe config core.sparsecheckout # timeout=10 > git.exe checkout -f 9500fe4d7c1012a475b719dcab2f71d9242ddc40 Commit message: “Update Jenkinsfile” > git.exe rev-list --no-walk 9500fe4d7c1012a475b719dcab2f71d9242ddc40 # timeout=10[sharedspace] $ F:\1.DevOps\2018\sonar-scanner-3.2.0.1227-windows\bin\sonar-scanner.bat -Dsonar.host.url=http://localhost:9000 ******** -Dsonar.language=java “-Dsonar.projectName=Simple Java project analyzed with the SonarQube Runner” -Dsonar.projectVersion=1.0 -Dsonar.sourceEncoding=UTF-8 -Dsonar.projectKey=java-sonar-runner-simple -Dsonar.java.binaries=. -Dsonar.sources=src -Dsonar.projectBaseDir=F:\1.DevOps\2018\JenkinsHomeTemplate\sharedspace INFO: Scanner configuration file: F:\1.DevOps\2018\sonar-scanner-3.2.0.1227-windows\bin\..\conf\sonar-scanner.properties INFO: Project root configuration file: F:\1.DevOps\2018\JenkinsHomeTemplate\sharedspace\sonar-project.properties INFO: SonarQube Scanner 3.2.0.1227 INFO: Java 1.8.0_121 Oracle Corporation (64-bit) INFO: Windows 10 10.0 amd64 INFO: User cache: C:\Users\Mitesh\.sonar\cache INFO: SonarQube server 7.1.0 INFO: Default locale: “en_IN”, source code encoding: “UTF-8” INFO: Publish mode INFO: Load global settings INFO: Load global settings (done) | time=72ms INFO: Server id: AWPE7tGddzPyN3syR8-G INFO: User cache: C:\Users\Mitesh\.sonar\cache INFO: Load plugins index INFO: Load plugins index (done) | time=92ms INFO: Load/download plugins INFO: Load/download plugins (done) | time=15ms INFO: Process project properties INFO: Load project repositories INFO: Load project repositories (done) | time=0ms INFO: Load quality profiles INFO: Load quality profiles (done) | time=37ms INFO: Load active rules INFO: Load active rules (done) | time=742ms INFO: Load metrics repository INFO: Load metrics repository (done) | time=26ms INFO: Project key: java-sonar-runner-simple INFO: Project base dir: F:\1.DevOps\2018\JenkinsHomeTemplate\sharedspace INFO: ------------- Scan Simple Java project analyzed with the SonarQube Runner INFO: Load server rules INFO: Load server rules (done) | time=150ms INFO: Base dir: F:\1.DevOps\2018\JenkinsHomeTemplate\sharedspace INFO: Working dir: F:\1.DevOps\2018\JenkinsHomeTemplate\sharedspace\.scannerwork INFO: Source paths: src INFO: Source encoding: UTF-8, default locale: en_IN INFO: Language is forced to java...INFO: 56 files indexed INFO: Quality profile for java: Sonar way INFO: Sensor JavaSquidSensor [java] INFO: Configured Java source version (sonar.java.source): none INFO: JavaClasspath initialization WARN: Bytecode of dependencies was not provided for analysis of source files, you might end up with less precise results. Bytecode can be provided using sonar.java.libraries property INFO: JavaClasspath initialization (done) | time=37ms INFO: JavaTestClasspath initialization INFO: JavaTestClasspath initialization (done) | time=0ms INFO: Java Main Files AST scan INFO: 56 source files to be analyzed INFO: Java Main Files AST scan (done) | time=5183ms INFO: Java Test Files AST scan INFO: 0 source files to be analyzed INFO: Java Test Files AST scan (done) | time=0ms INFO: 56/56 source files have been analyzed INFO: Sensor JavaSquidSensor [java] (done) | time=5827ms INFO: Sensor SurefireSensor [java] INFO: 0/0 source files have been analyzed INFO: parsing [F:\1.DevOps\2018\JenkinsHomeTemplate\sharedspace\target\surefire-reports] INFO: Sensor SurefireSensor [java] (done) | time=9ms INFO: Sensor JaCoCoSensor [java] INFO: Sensor JaCoCoSensor [java] (done) | time=2ms INFO: Sensor SonarJavaXmlFileSensor [java] INFO: Sensor SonarJavaXmlFileSensor [java] (done) | time=1ms INFO: Sensor Zero Coverage Sensor INFO: Sensor Zero Coverage Sensor (done) | time=136ms INFO: Sensor CPD Block Indexer INFO: Sensor CPD Block Indexer (done) | time=285ms INFO: SCM provider for this project is: git INFO: 56 files to be analyzed INFO: 56/56 files analyzed INFO: 23 files had no CPD blocks INFO: Calculating CPD for 33 files INFO: CPD calculation finished INFO: Analysis report generated in 799ms, dir size=299 KB INFO: Analysis reports compressed in 304ms, zip size=185 KB INFO: Analysis report uploaded in 981ms INFO: ANALYSIS SUCCESSFUL, you can browse http://localhost:9000/dashboard/index/java-sonar-runner-simpleINFO: Note that you will be able to access the updated dashboard once the server has processed the submitted analysis report INFO: More about the report processing at http://localhost:9000/api/ce/task?id=AWqHV9bjtqJgBBf-zNPP INFO: Task total time: 15.022 s INFO: ------------------------------------------------------------------------ INFO: EXECUTION SUCCESS INFO: ------------------------------------------------------------------------ INFO: Total time: 17.013s INFO: Final Memory: 20M/418MINFO: ------------------------------------------------------------------------ Notifying upstream projects of job completion Finished: SUCCESS |
Once the build or pipeline is executed successfully, you can go to the SonarQube portal and verify the recently analysed project.
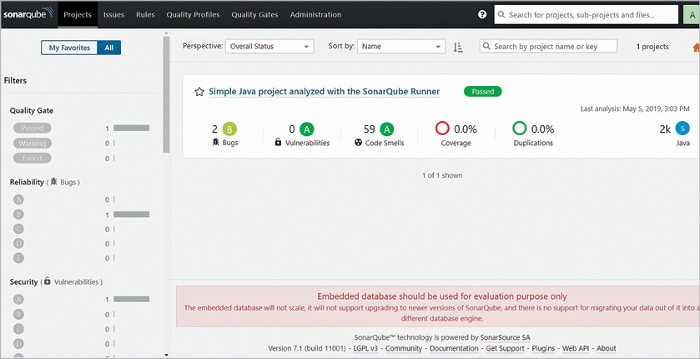
Verifying the bugs, vulnerabilities and code smells
There are different tools for different languages:
- Java, .NET, JavaScript, etc: SonarQube
- Android: Lint
- iOS: SwiftLint, OCLint
Code analysis tools can be integrated in the automation pipeline using plugins or the command line.
Continuous integration (CI)
In the traditional organisational culture, manual activities are paramount in the management of the application’s life cycle. Organisations, project teams and business units face many challenges, as shown in Figure 3.
What is the immediate solution to address the challenges mentioned in Figure 3? The answer is continuous integration (CI), which is one of the main DevOps practices and a pillar of this culture’s transformation process. Each check-in from a developer can trigger a build job or pipeline that performs automated build, unit test execution and package creation. CI helps to detect issues in the code, based on compilation and unit test execution, at an early stage. The faster you fail, the faster you recover.
The objective of automation is to make existing practices and processes more effective in a way that communication and collaboration between teams becomes better.
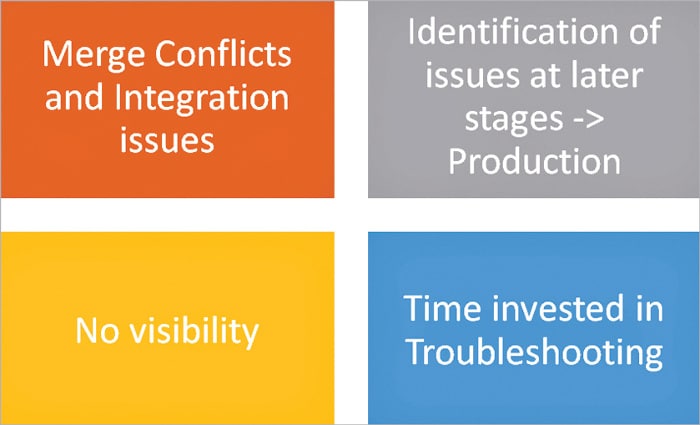
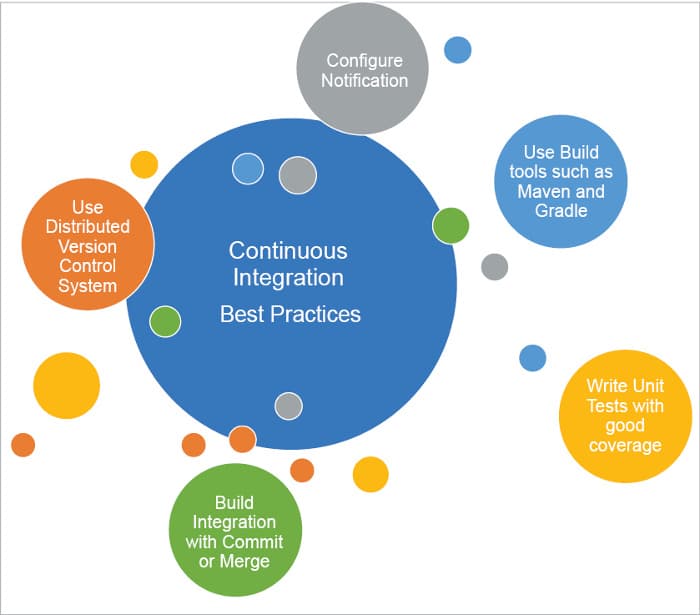
Figure 4 shows some of the best practices to make CI more effective.
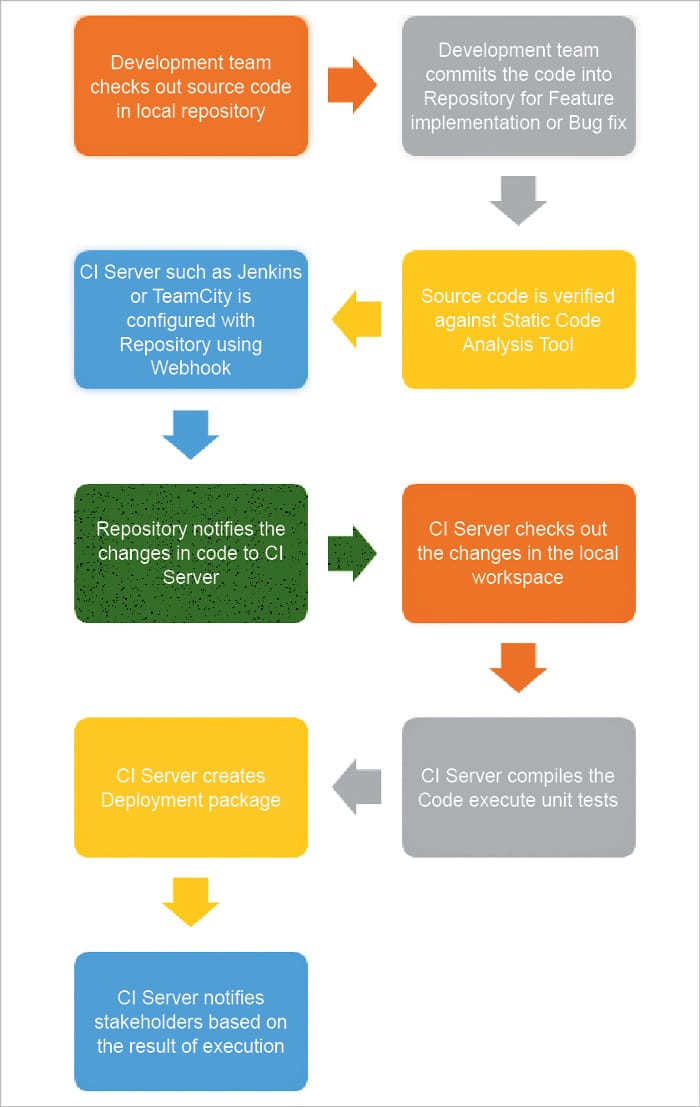
Let’s understand, from Figure 5, how CI flows. We can also consider it as outlining the following steps.
Create a Build Job in Jenkins and configure the command mvn clean package. Before executing this command, configure Maven, JDK and Git in Manage Jenkins -> Global Tools Configuration.
The following is a console log of a Jenkins job that executes a sample Java application. Click on Build Now in the Jenkins dashboard.
Started by user admin Building in workspace F:\1.DevOps\2018\JenkinsHomeTemplate\sharedspace No credentials specified > git.exe rev-parse --is-inside-work-tree # timeout=10 Fetching changes from the remote Git repository > git.exe config remote.origin.url https://github.com/mitesh51/spring-petclinic.git # timeout=10 Fetching upstream changes from https://github.com/mitesh51/spring-petclinic.git ...Parsing POMs Established TCP socket on 53326 [sharedspace] $ “C:\Program Files (x86)\Java\jdk1.8.0_192/bin/java” -cp F:\1.DevOps\2018\JenkinsHomeTemplate\plugins\maven-plugin\WEB-INF\lib\maven35-agent-1.12.jar;F:\1.DevOps\2018\apache-maven-3.5.3\boot\plexus-classworlds-2.5.2.jar;F:\1.DevOps\2018\apache-maven-3.5.3/conf/logging jenkins.maven3.agent.Maven35Main F:\1.DevOps\2018\apache-maven-3.5.3 F:\1.DevOps\2018\JenkinsHomeTemplate\war\WEB-INF\lib\remoting-3.29.jar F:\1.DevOps\2018\JenkinsHomeTemplate\plugins\maven-plugin\WEB-INF\lib\maven35-interceptor-1.12.jar F:\1.DevOps\2018\JenkinsHomeTemplate\plugins\maven-plugin\WEB-INF\lib\maven3-interceptor-commons-1.12.jar 53326 <===[JENKINS REMOTING CAPACITY]===>channel started Executing Maven: -B -f F:\1.DevOps\2018\JenkinsHomeTemplate\sharedspace\pom.xml clean package [INFO] Scanning for projects... [HUDSON] Collecting dependencies info [INFO] [INFO] ------------< org.springframework.samples:spring-petclinic >------------ [INFO] Building petclinic 4.2.5-SNAPSHOT [INFO] --------------------------------[ war ]--------------------------------- [INFO] [INFO] --- maven-clean-plugin:2.5:clean (default-clean) @ spring-petclinic --- [INFO] Deleting F:\1.DevOps\2018\JenkinsHomeTemplate\sharedspace\target [INFO] [INFO] --- cobertura-maven-plugin:2.7:clean (default) @ spring-petclinic --- [INFO] [INFO] --- maven-resources-plugin:2.6:resources (default-resources) @ spring-petclinic --- [INFO] Using ‘UTF-8’ encoding to copy filtered resources. [INFO] Copying 18 resources ...[INFO] --- maven-resources-plugin:2.6:testResources (default-testResources) @ spring-petclinic --- [INFO] Using ‘UTF-8’ encoding to copy filtered resources. [INFO] Copying 11 resources [INFO] skip non existing resourceDirectory F:\1.DevOps\2018\JenkinsHomeTemplate\sharedspace\src\test\resources [INFO] [INFO] --- maven-compiler-plugin:3.0:testCompile (default-testCompile) @ spring-petclinic --- [INFO] Changes detected - recompiling the module! [INFO] Compiling 11 source files to F:\1.DevOps\2018\JenkinsHomeTemplate\sharedspace\target\test-classes....INFO LocalContainerEntityManagerFactoryBean - Closing JPA EntityManagerFactory for persistence unit ‘petclinic’ Results : Tests run: 59, Failures: 0, Errors: 0, Skipped: 0 [JENKINS] Recording test results ...[INFO] Packaging webapp [INFO] Assembling webapp [spring-petclinic] in [F:\1.DevOps\2018\JenkinsHomeTemplate\sharedspace\target\spring-petclinic-4.2.5-SNAPSHOT] [INFO] Processing war project [INFO] Copying webapp resources [F:\1.DevOps\2018\JenkinsHomeTemplate\sharedspace\src\main\webapp] [INFO] Webapp assembled in [1254 msecs] [INFO] Building war: F:\1.DevOps\2018\JenkinsHomeTemplate\sharedspace\target\petclinic.war [WARNING] Attempt to (de-)serialize anonymous class org.jfrog.hudson.maven2.MavenDependenciesRecorder$1; see: https://jenkins.io/redirect/serialization-of-anonymous-classes/Notifying upstream projects of job completion Join notifier requires a CauseAction [INFO] ------------------------------------------------------------------------ [INFO] BUILD SUCCESS [INFO] ------------------------------------------------------------------------ [INFO] Total time: 18.493 s [INFO] Finished at: 2019-05-05T15:34:14+05:30 [INFO] ------------------------------------------------------------------------ Waiting for Jenkins to finish collecting data [JENKINS] Archiving F:\1.DevOps\2018\JenkinsHomeTemplate\sharedspace\pom.xml to org.springframework.samples/spring-petclinic/4.2.5-SNAPSHOT/spring-petclinic-4.2.5-SNAPSHOT.pom [JENKINS] Archiving F:\1.DevOps\2018\JenkinsHomeTemplate\sharedspace\target\petclinic.war to org.springframework.samples/spring-petclinic/4.2.5-SNAPSHOT/spring-petclinic-4.2.5-SNAPSHOT.war channel stopped Archiving artifacts Notifying upstream projects of job completion Finished: SUCCESS |
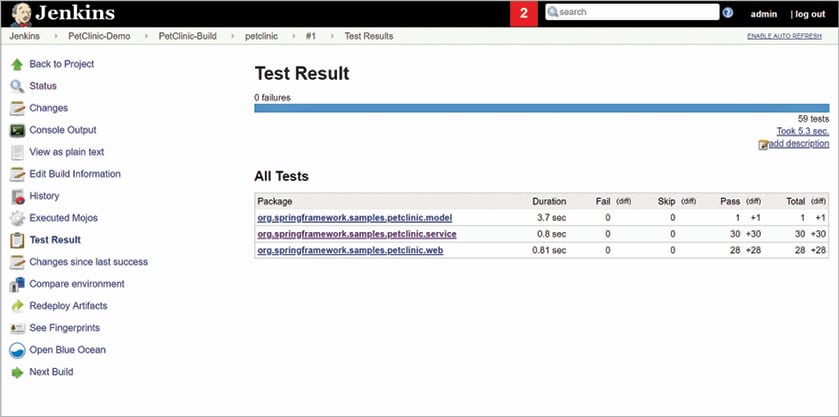
On the Jenkins dashboard, test results are available after the successful execution of the build.
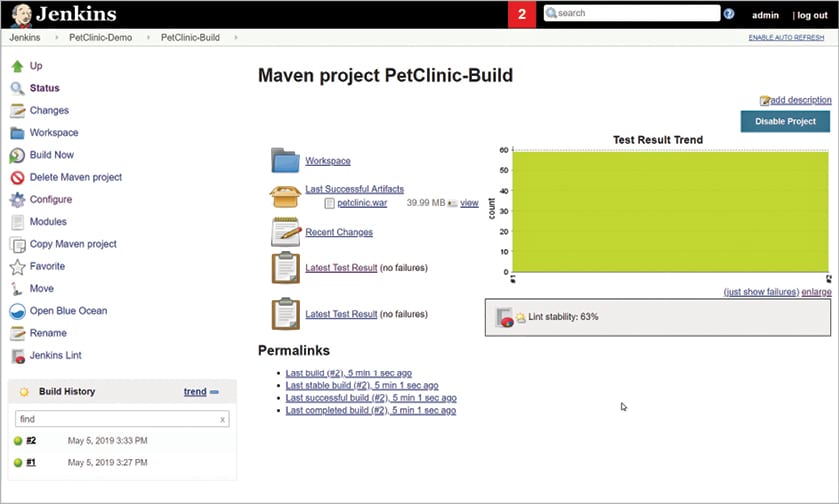
Artefacts can be archived in the post-build step of the Jenkins job. After the successful execution of the build, the package is archived.
Continuous integration makes continuous delivery (CD) a natural next step.
Continuous delivery (CD)
This is all about deploying a package, an application version or a product increment to a specific environment in an automated way. Automation can be in the form of executing a script for package deployment, plugins to deploy an application on to a different Web server or application server, as well as the deployment or integration with different cloud platforms such as AWS, Microsoft Azure, etc. Deployment to specific environments can be done based on approvals, to maintain proper governance.


