


Any business that has a website aims for high-performance Web content delivery. The consequences of a sluggish, poorly performing website or application may cause tremendous losses to the organisation. Web optimisation addresses this issue, and this article features some of the best open source optimisation tools available.
The performance of websites and website applications has a huge impact on businesses that are dependent on them, day-in day-out. Sometimes these performance bottlenecks result in huge losses to the business or bring them to a standstill. It is good practice for any engineering team in an organisation to carry out regular performance checks (testing at a regular interval). They have to foresee challenges like scalability, well in advance.
For this purpose, one needs a good performance measurement tool or toolset. There are plenty of these available in this field. I will, however, describe a few important and popular open source tools.
There are various steps that can be taken to optimise or improve Web application performance. The following are some of the well-known and much used measures:
- Cleaning up of the HTML document on a regular basis for unwanted clutter.
- Always making sure that CSS performance is at an optimised level. This helps to a great extent.
- Reducing the use of unwanted tags in the code as much as possible and minimising CSS, JS, HTML, etc.
- Reducing external HTTP requests as much as possible. This prevents a lot of unnecessary calls.
- Always enabling prefetching.
- Making sure that the CDN (content delivery network) for the Web application is configured properly and, if required, increasing the speed of a CDN and caching.
- It is always a good practice to compress files and optimise images.
In addition to the above measures, one can use a better tool or toolset to measure Web application performance. Before finalising or shortlisting any tool, one has to consider load times, the value outcome of performances to be measured and what was the prior experience, along with metrics of the performance testing. A clear picture of these aspects is a must.
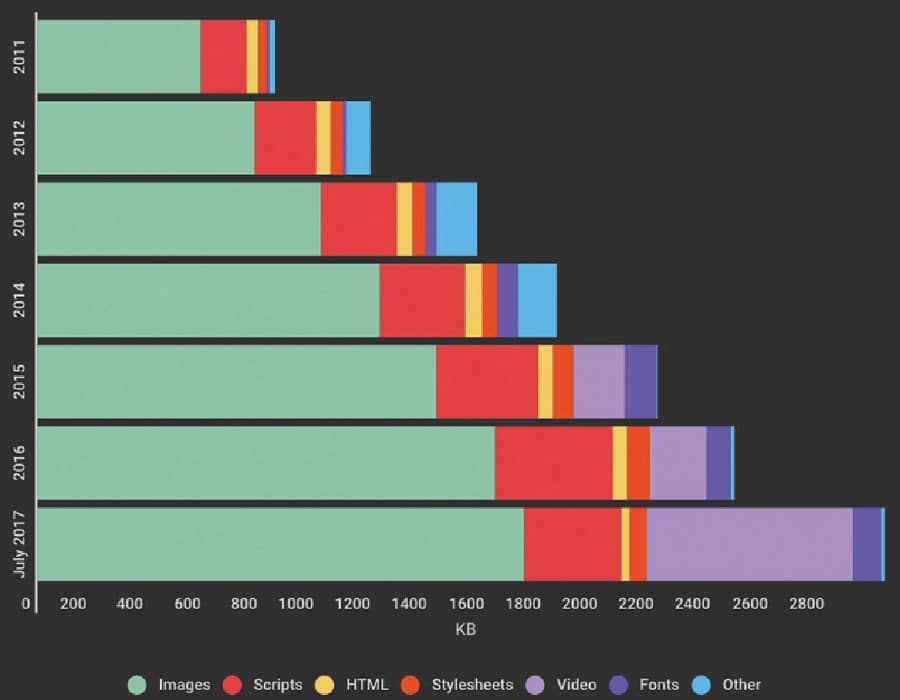

Figure 1 shows the graph depicting Web page growth over the years, of various types of content.
Some of the popular open source tools for Web optimisation are featured below.
JMeter: A load and performance tester
JMeter (https://jmeter.apache.org/) is a Java based open source tool supported by the Apache Software Foundation. It was developed and designed to load-test functional behaviour and measure the performance of any website or Web application. It was originally designed for testing Web applications but has since been enhanced to offer other test functions.
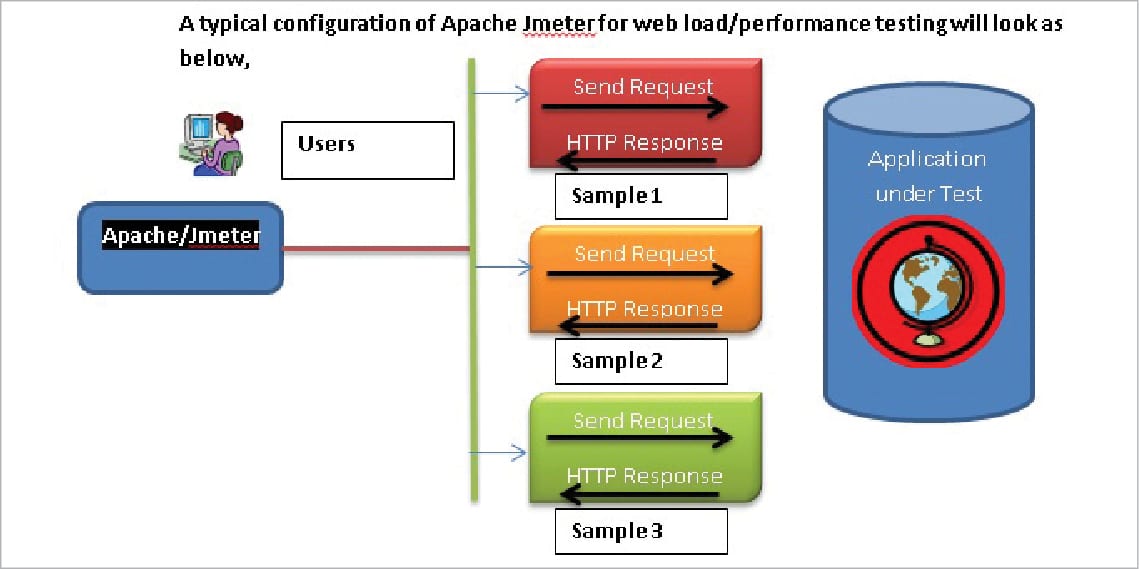
When we need performance across the complete Web environment, we need to have a proper configuration setup to carry out thorough evaluation. The typical configuration of Apache JMeter for Web load/performance testing will look like what’s shown in Figure 3.

The key features of JMeter are:
- The ability to test the load and performance of many different applications, servers and protocols along with Web based applications.
- Supports all Web standards like HTTP, HTTPS (Java, Node.js, PHP, ASP.NET, etc)
- Supports all major APIs like SOAP/REST Web services and Java objects
- Supports File Transfer Protocol (FTP) and TCP
- Databases are supported using JDBC
- Security features like LDAP are supported
- Message-oriented middleware (MOM) via JMS
- Protocols like Mail-SMTP(S), POP3(S) and IMAP(S) are supported
- Supports both native commands or shell scripts
Grinder: A Java load-testing framework
Grinder (http://grinder.sourceforge.net/) is a Java load testing framework. Its features make it easy to run a distributed test using many load injector machines. Grinder is free and is available under a BSD-style open source licence.
Some of the key features of Grinder are listed below:
- Generic approach load test: This means that anything that has a Java API will be supported, including HTTP Web servers, SOAP and REST Web services, as well as application servers (CORBA, RMI, JMS, EJBs, etc) and custom protocols.
- Grinder supports flexible scripting: In most cases, test scripts are written in the powerful Jython and Clojure languages. This helps in developing test cases and powerful test architecture.
- Grinder comes with a distributed framework: Since it has a graphical console, this allows multiple load injectors to be monitored and controlled, and provides centralised script editing and distribution.
- Mature HTTP support: Automatic management of client connections and cookies.
- Dynamic scripting: Test scripts are written using a dynamic scripting language and specify the tests to run. The default script language is Jython (which is a Java implementation of the popular Python language).
- Supports SSL, a proxy-aware feature, as well as connection throttling.
- Grinder has a sophisticated feature to record and replay the interaction between a browser and a website.

Selenium
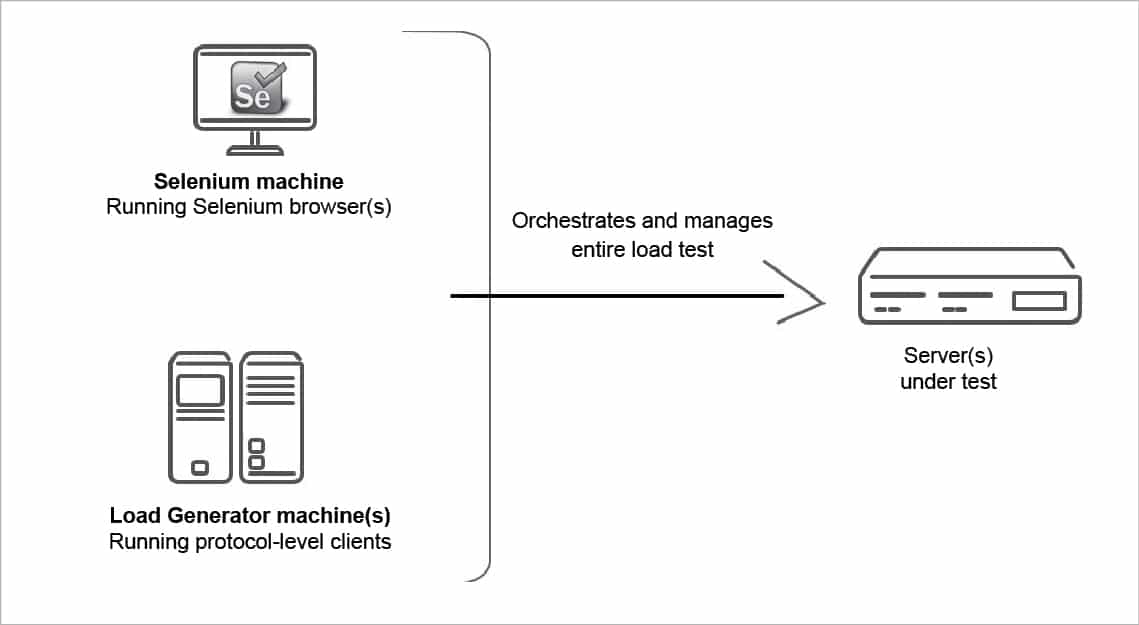
Selenium (https://www.seleniumhq.org/) is a suite of tools to automate Web browsers across many platforms. It runs in many browsers and operating systems, and can be controlled by many programming languages and testing frameworks. Figure 6 shows the configuration for carrying out Selenium based load testing.
There are many other tools, as listed below, which also can be considered as alternatives for performance and load testing, based on an organisation’s needs.
Locust.io: This is a great tool that is mainly used for understanding the performance on the server side.
Bees with Machine Guns: This is a utility based tool for creating micro EC2 instances to attack Web applications as targets.
Multi-Mechanize: This is an open source framework for performance and load testing that runs concurrent Python scripts to generate load (synthetic transactions).
Siege: This HTTP load-testing and benchmarking utility was designed to let Web developers measure code under duress, to see how it stands up to load on the Internet. Siege supports basic authentication, cookies, HTTP and HTTPS protocols, and lets the user hit a Web server with a configurable number of simulated Web browsers.
Apache Bench: This tool is used for benchmarking an Apache HTTP server, to get an evaluation on how it performs.
Httperf: This tool measures a Web server’s performance and provides a flexible facility for generating varied HTTP workloads and measuring server performance. The focus is not on implementing a particular benchmark but on providing a robust, high-performance tool that facilitates the creation of both micro- and macro-level benchmarks.
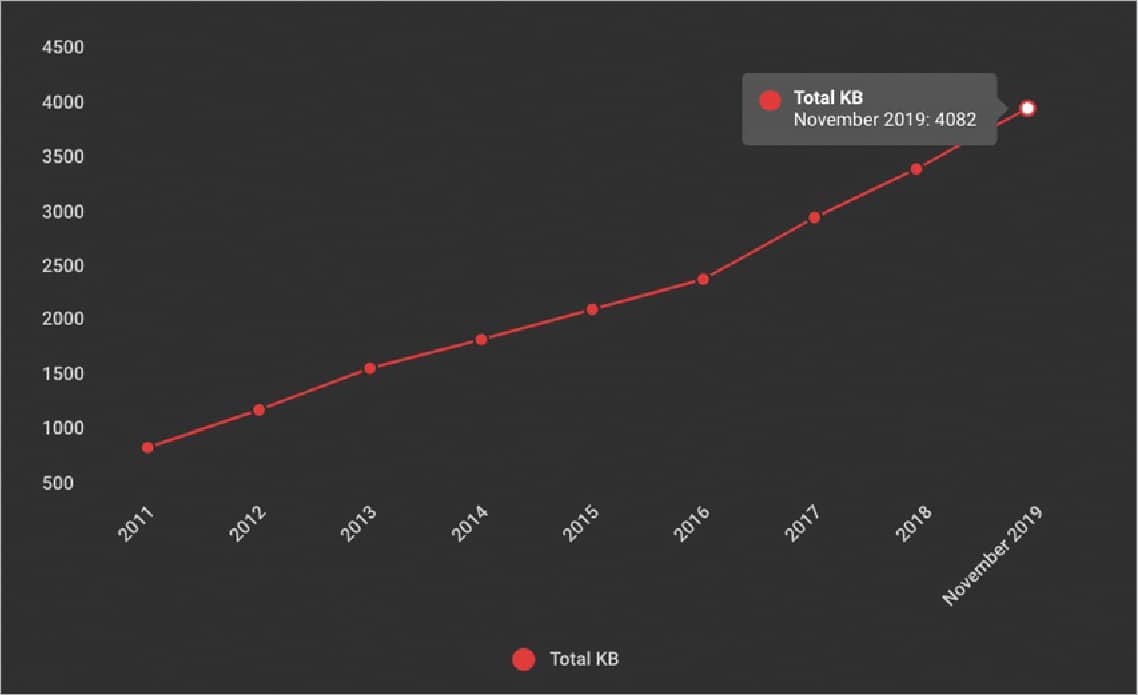
Web page performance testing for scalability, load and stress needs to be carried out on a constant basis to make sure that all needs of the future are met. Figure 7 shows the rate of growth of a 4MB Web page. Once the test results are out, some of the above mentioned optimisation methods and measures can be taken for future performance enhancement of Web pages and applications.


