A network connects computers, mobile phones, peripherals and IoT devices, providing communication between them. It also facilitates communication between different networks and even with the Internet. So you must try and get to know it better.
For better understanding of the configuration of the computer network surrounding you, you should start from the machine that you are currently logged in to. This will give you all the necessary network configuration parameters, like the IP address of the present host, the DNS configuration, and which other machines are connected to and can communicate with your network.
Finding configuration information
In a UNIX platform, the easiest way to identify the basic configuration of a host is to use hostname, ifconfig and netstate commands. A few system text files are also useful to find out details about the internal configuration. These include /etc/nsswitch.conf, /etc/resolv.conf , and so on. Using this information, you can directly determine the identity of your machine and its location.
A little study of the ifconfig command can provide you with lots of basic network configuration and communication information of the connected network devices. For example, the following listing of the ifconfig –a command gives the Internet address and netmask of the connected network device and can explore the underlying network configuration. If the host machine has multiple network interfaces, then for each device it will show the corresponding device network information.
>ifconfig -a

eno16777984: flags=4163<UP,BROADCAST,RUNNING,MULTICAST>mtu 1500

inet 172.16.4.102 netmask 255.255.252.0 broadcast 172.16.7.255

inet6 fe80::20c:29ff:fe3d:4db0prefixlen 64 scopeid 0x20<link>

ether 00:0c:29:3d:4d:b0 txqueuelen 1000 (Ethernet)

RX packets 1869057322 bytes 295709999938 (275.4 GiB)

RX errors 0 dropped 4028609 overruns 0 frame 0

TX packets 2499818214 bytes 798685297206 (743.8 GiB)

TX errors 0 dropped 0 overruns 0 carrier 0 collisions 0

lo: flags=73<UP,LOOPBACK,RUNNING>mtu 65536

inet 127.0.0.1 netmask 255.0.0.0

inet6 ::1 prefixlen 128 scopeid 0x10<host>

loop txqueuelen 0 (Local Loopback)

RX packets 19736 bytes 1686740 (1.6 MiB)

RX errors 0 dropped 0 overruns 0 frame 0

TX packets 19736 bytes 1686740 (1.6 MiB)

TX errors 0 dropped 0 overruns 0 carrier 0 collisions 0
From the above listing, one can identify some of the basic network configuration elements, as shown below:
IP/netmask: 172.16.4.120/22

Mask: 255:255:252.0

Network Subnet ID: 172.16.4.0

First usable: 172.16.4.1

Last usable: 172.16.7.254

Broadcast: 172.16.7.255

Maximum Subnets: 64

Hosts per Subnet: 1022

Host Address Range: 172.16.4.1 – 172.16.7.254
The netmask parameter is particularly important, since it alone can tell you the size of your immediate network. In this case, 255.255.252.0 equates to four Class B addresses, because the difference of maximum number of hosts (256) and the number of masked hosts (252) is four. By combining the netmask with the configured IP address, it is possible to guess the range of the IP addresses in the local network. Because IP blocks are usually divided by whole groups and in sequence, you can tell that the IP address span of the network is from 172.16.4.1 to 172.16.7.254. The network and broadcast addresses are 172.16.4.0 and 177.16.7.255, respectively. A possible schematic diagram of the network is shown in Figure 1.
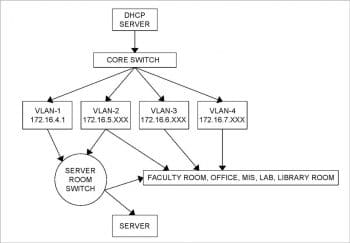
If there are multiple network devices, then ifconfig will return information for each device in the output, and from each interface it is possible to reach all the connecting networks and analyse all of them.
A few UNIX files are also useful to investigate a network. These contain the network information required to understand and explore the configuration. /etc/nsswitch.conf and /etc/resolv.conf are two useful configuration system text files and can be viewed using the cat command call. Both the files reside on the /etc directory. A listing of different files containing the data to resolve network configuration is available in the nsswitch.conf file, whereas DNS name server information is available in the resolv.conf file.
>cat /etc/nisswitch.conf

…..

………..

bootparams: nisplus [NOTFOUND=return] files

ethers: files

netmasks: files

networks: files

protocols: files

rpc: files

services: files sss

netgroup: files sss

publickey: nisplus

automount: files

aliases: files nisplus

>cat /etc/resolv.conf

# Generated by NetworkManager

search ism.int

nameserver 172.16.8.9

nameserver 202.56.230.2

nameserver 8.8.8.8
After getting to know the configuration of your own network, it is essential to go beyond and learn about what is within the network, and how to reach there. Networks outside your masked network may be within your own organisation, in different sections or departments; or on outside public networks such as the Internet. To view your network and beyond, it is necessary to see the router table, for which netstat –r is a good option.
Here is an example of the netstat –r command on a CentOS platform. The default router shows the gateway used to route packets to the outside network. In the absence of the proper functioning of the present name server, the gateway option shows the IP addresses instead of the complete qualified route. In the following example, netstat –r is showing the IP router table of the above mentioned network.
>netstat -r

Kernel IP routing table

Destination Gateway Genmask Flags MSS Window irtt Iface

default 172.16.4.1 0.0.0.0 UG 0 0 0 eno 16777984

172.16.4.0 0.0.0.0 255.255.252.0 U 0 0 0 eno 16777984

172.16.200.0 0.0.0.0 255.255.252.0 U 0 0 0 eno 16777984
The above output of netstat –r with IP addresses indicates that the name server of the target network is not functioning properly or has some configuration issues.
After finding out the basic configuration, one can explore all the connected hosts with respect to each subnet identified by the router table entries. There are two useful commands, ip and arp, with the help of which it is possible to get data on all the close neighbours, along with their respective MAC addresses. The administrative command ip is so powerful that it is also possible to use it for manipulating routing devices, and editing routing and tunnelling policies. While arp is good to identify the connected hosts with their MAC addresses and connection types, ip can show you the status of the connections.
>arp

Address HWtype HWaddress Flags Mask Iface

172.16.6.83 ether 34:17:eb:b4:9b:6d C eno16777984

172.16.4.66 ether e4:11:5b:4b:d0:63 C eno16777984

172.16.5.96 ether a0:48:1c:9e:72:02 C eno16777984

172.16.5.230 ether e0:cb:4e:ff:7e:bd C eno16777984

172.16.5.213 ether a0:b3:cc:e8:e4:16 C eno16777984

172.16.7.226 ether 6c:62:6d:d2:1e:70 C eno16777984

172.16.5.60 ether 10:78:d2:53:1b:ee C eno16777984

172.16.7.142 ether 08:ec:a9:ec:b1:9d C eno16777984

172.16.5.241 ether 04:7d:7b:fa:b7:c0 C eno16777984
The network management command ip with the option neigh provides more detailed information than the other network management and exploration commands.
>ip neigh

172.16.6.83 dev eno16777984 lladdr 34:17:eb:b4:9b:6d STALE

172.16.4.66 dev eno16777984 lladdr e4:11:5b:4b:d0:63 STALE

172.16.5.96 dev eno16777984 lladdr a0:48:1c:9e:72:02 STALE

172.16.5.230 dev eno16777984 lladdr e0:cb:4e:ff:7e:bd REACHABLE

172.16.5.213 dev eno16777984 lladdr a0:b3:cc:e8:e4:16 STALE

172.16.7.226 dev eno16777984 lladdr 6c:62:6d:d2:1e:70 STALE

172.16.5.60 dev eno16777984 lladdr 10:78:d2:53:1b:ee STALE

172.16.7.142 dev eno16777984 lladdr 08:ec:a9:ec:b1:9d STALE

172.16.5.241 dev eno16777984 lladdr 04:7d:7b:fa:b7:c0 STALE

172.16.200.88 dev eno16777984 lladdr 00:16:c7:2c:3f:bf STALE

172.16.4.54 dev eno16777984 lladdr 00:15:5d:07:55:0b

REACHABLE

172.16.6.108 dev eno16777984 lladdr 34:17:eb:b4:9c:01 STALE

172.16.200.90 dev eno16777984 lladdr 00:16:c7:2c:3f:bf STALE

172.16.5.243 dev eno16777984 lladdr 20:47:47:1f:5e:2f STALE
The above table provides a neighbourhood host reachability status as well. It classifies the reachability in four classes – valid permanent connection, valid but not further tested, reachable but with the reachable timeout limit, and suspicious. With all these, it is possible to get a good understanding of your neighbourhood to investigate the performance of the network, if required.
Services and socket connectivity
To understand which services are running within your server and expecting outside hosts to cater their services to them, you need to go through the currently running services and examine their status. Naturally, these include DNS, NFS, Web services and other distributed services within the network. A close look at this data can help a network analyst or security expert to easily identify the possible sources of performance bottlenecks and external attacks. The information is based upon the ports that are open and in the listening state, waiting for a client’s connections, or to those that are already open and communicating with a client.
Sockets
A socket is the handshaking protocol that provides connection-oriented communication between a server and all the hosts within its network. It has a well-defined flow of events. In a connection-oriented client-to-server model, the socket on the server process awaits requests from a client. The server first binds an address and a port to the socket that a client can use to find the server. When there is a definite address and port combination for a service, the server waits for clients to request the service through its own address and port combination. The server performs the client’s request and sends the reply to the client.
Performance determines whether different applications and services are communicating properly, waiting for data over the network, or whether clients are having trouble connecting or receiving information.
Performance issues affect the reliability of applications running in the system as well as the reliability of the entire environment. In most cases, a decline in performance is related either to latency or to bandwidth and hardware.
Since we cannot exceed the physical limit of the network environment, it is necessary to address performance issues with respect to specific service protocols and services like NFS, DNS, HTTP, etc. The limiting factors of the network and other related hardware provide the base line for the performance study. Once the base line is known, it is comparatively easy to identify the performance issues related to different service protocols.
After the correct diagnosis, one can identify related issues and the correct course of action can be taken.
The statistical data analysis of different log tables is helpful in this regard. Both predictive and deterministic analyses are used to precisely locate performance issues. If an issue is not creating a major performance bottleneck, a system study and analysis can identify the problem and solve it.
The client-to-server data exchange takes place when a client connects to the server through a socket. A socket pair, in this case, consists of a client IP address, a client port number, a server IP address, and a server port number. Querying information by the socket therefore lets you zero-in quickly on a specific service running at a specific IP address.
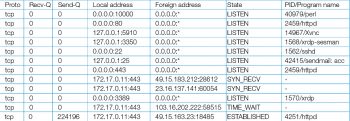
$ netstat –antplF
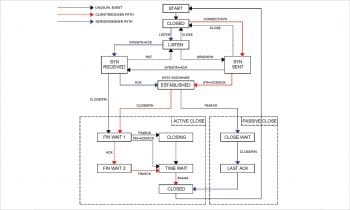
The various handshaking communication protocol states are CLOSED, SYN_SENT, ESTABLISHED, FIN_WAIT_1, FIN_WAIT_2 and TIME_WAIT. A connection state ESTABLISHED means that there is a connection, whereas LISTEN means that the socket is waiting for a connection — one is waiting for a connection to be made while the other is already connected. An ESTABLISHED state means that both the hosts have successfully completed the TCP three-way handshake by a successful transition from SYN_SENT to the ESTABLISHED state. A transition from CLOSED to SYN_SENT happens when the client side sends the TCP SYN request to the server. From the above netstat command it is possible to get a detailed and periodic status report of client-server communication. Figure 5 gives a bar-plot of Figure 3 to graphically represent the communication status.
# R language script

netstat<- read.table(“netstat_2_csv.csv”,header=TRUE,sep=”,”)

head(netstat)

detach(netstat)

attach(netstat)

barplot(

table(d),

beside = TRUE,

col = c(“lightblue”, “mistyrose”, “lightcyan”,”lavender”, “cornsilk”,”red”),

legend = rownames(table(d)), ylim = c(0, 150),

args.legend = list(x = “topright”, bty = “n”, inset=c(0.3, 0))

)
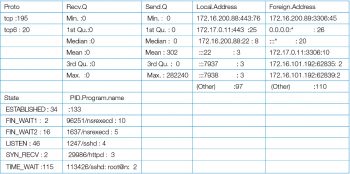
A summary report of the above log is helpful to gain an in-depth understanding of the system. Figure 4 gives an R summary report of the above netstat status log.
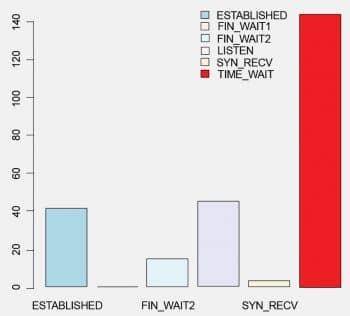
If an application is behind a firewall and is in the idle state, then there is a possibility that the firewall may drop the idle TCP connection after a given amount of time. Since there is no way to know the invalid connection, the system will keep the connection forever, and when the client tries to use that connection again, it will be unresponsive.
Acknowledgment: I am thankful to Indrajit Prasad of Wizertech Informatics Pvt Ltd, Kolkata, for his cooperation during the preparation of this article.


