
This is the 18th article in the DevOps series and it discusses the Ansible deployment of Monit, a free and open source utility for managing and monitoring processes, programs, files, directories and file systems on a *nix system.
Monit is a free and open source process supervision tool for *nix systems. It can also be used to monitor files and directories, and perform maintenance or repair tasks. The system status check can be done on the command line and viewed in a browser. It is written entirely in C and released under the AGPL 3.0 licence. In this 18th article in the DevOps series, we will learn to install and set up Monit for the system, as well as the SSH daemon and Nginx Web server monitoring.
Setting it up
A Debian 9 (x86_64) guest virtual machine (VM) using KVM/QEMU will be set up and monitored using Monit.
The host system is a Parabola GNU/Linux-libre x86_64 system and Ansible is installed using the distribution package manager. The version of Ansible used is 2.6.0, as indicated below:
$ ansible --versionansible 2.6.0 config file = /etc/ansible/ansible.cfg configured module search path = [‘/home/guest/.ansible/plugins/modules’, ‘/usr/share/ansible/plugins/modules’] ansible python module location = /usr/lib/python3.6/site-packages/ansible executable location = /usr/bin/ansible python version = 3.6.5 (default, May 11 2018, 04:00:52) [GCC 8.1.0] |
The Ansible playbook and inventory file are created on the host system as follows:
ansible/inventory/kvm/ /playbooks/configuration/ |
The inventory/kvm/inventory file contains the following code:
debian ansible_host=192.168.122.197 ansible_connection=ssh ansible_user=debian ansible_password=password |
The default Debian 9 installation does not have the sudo package installed. Log in to the VM and install the sudo package. The ‘debian’ user also requires sudo access:
root@debian:~# apt-get install sudoroot@debian:~# adduser debian sudoAdding user `debian’ to group `sudo’...Adding user debian to group sudoDone. |
You should add an entry in /etc/hosts file for the Debian VM as shown below:
192.168.122.197 debian |
You can now test connectivity from Ansible to the Debian 9 VM using the following command:
$ ansible -i inventory/kvm/inventory debian -m pingdebian | SUCCESS => { “changed”: false, “ping”: “pong”} |
Installation
The Debian software package repository is first updated and then Monit is installed. The net-tools package is installed to provide the netstat command in the system. The Monit service is then started using systemd. The Ansible playbook for the above tasks is provided below, for reference:
---- name: Install Monit hosts: debian become: yes become_method: sudo gather_facts: yes tags: [install] tasks: - name: Update the software package repository apt: update_cache: yes - name: Install monit package: name: “{{ item }}” state: latest with_items: - net-tools - monit - name: Start monit service systemd: name: monit.service state: started |
The above playbook can be invoked using the following command:
$ ansible-playbook -i inventory/kvm/inventory playbooks/configuration/monit.yml --tags install -vv -K |
The -vv represents the verbosity in the Ansible output. You can use up to four ‘v’s for a more detailed output. The -K option prompts for the sudo password for the Debian user account.
Web interface
Monit software provides a Web interface that listens on port 2812. The default configuration file for Monit is located at /etc/monit/monitrc. The Web UI port needs to be enabled with basic login credentials. After making changes to the configuration file, the service needs to be restarted. The Ansible playbook to enable the Monit’s Web interface is as follows:
- name: Configure UI hosts: debian become: yes become_method: sudo gather_facts: true tags: [ui] tasks: - lineinfile: path: /etc/monit/monitrc regexp: ‘httpd port 2812’ line: ‘set httpd port 2812 and’- lineinfile: path: /etc/monit/monitrc regexp: ‘# allow admin:monit’ line: ‘ allow admin:monit’- name: Restart monit service systemd: name: monit.service state: restarted- wait_for: port: 2812 |
The execution of the above playbook to enable the Web interface is shown below:
$ ansible-playbook -i inventory/kvm/inventory playbooks/configuration/monit.yml --tags ui -KSUDO password:PLAY [Install Monit] ****************************************TASK [Gathering Facts] **************************************ok: [debian]PLAY [Configure UI] ******************************************TASK [Gathering Facts] **************************************ok: [debian]TASK [lineinfile] ********************************************changed: [debian]TASK [lineinfile] ********************************************changed: [debian]TASK [Restart monit service] ********************************changed: [debian]TASK [wait_for] *********************************************ok: [debian]PLAY [Configure ssh monitoring] ******************************TASK [Gathering Facts] **************************************ok: [debian]PLAY [Configure ssh monitoring] ******************************TASK [Gathering Facts] **************************************ok: [debian]PLAY RECAP **************************************************debian : ok=8 changed=3 unreachable=0 failed=0 |
You can use the netstat command to verify that Monit is listening on port 2812 as shown below:
$ netstat -na | grep :2812tcp 0 0 0.0.0.0:2812 0.0.0.0:* LISTENtcp6 0 0 :::2812 :::* LISTEN |
The syntax validation of the Monit configuration file can be checked using the following command:
$ sudo monit -tControl file syntax OK |
The status of the Monit service can be verified as indicated below:
$ sudo monit statusMonit 5.20.0 uptime: 2mSystem ‘debian’status Runningmonitoring status Monitoredmonitoring mode activeon reboot startload average [0.00] [0.02] [0.00]cpu 0.4%us 0.3%sy 0.0%wamemory usage 45.5 MB [4.6%]swap usage 0 B [0.0%]uptime 56mboot time Mon, 09 Jul 2018 15:03:06data collected Mon, 09 Jul 2018 15:57:42 |
A summary report of the Monit service can also be printed in the console output as follows:
$ sudo monit summaryMonit 5.20.0 uptime: 4m┌─────────────────────────────────┬────────────────────────────┬───────────────┐│ Service Name │ Status │ Type │├─────────────────────────────────┼────────────────────────────┼───────────────┤│ debian │ Running │ System │└─────────────────────────────────┴────────────────────────────┴───────────────┘ |
The status of the Monit service can also be checked from the command line using systemctl, as shown below:
$ sudo systemctl status monit[sudo] password for debian:● monit.service - LSB: service and resource monitoring daemonLoaded: loaded (/etc/init.d/monit; generated; vendor preset: enabled)Active: active (running) since Mon 2018-07-09 15:55:42 IST; 1min 21s agoDocs: man:systemd-sysv-generator(8)Process: 2293 ExecStop=/etc/init.d/monit stop (code=exited, status=0/SUCCESS)Process: 2298 ExecStart=/etc/init.d/monit start (code=exited, status=0/SUCCESS)Tasks: 2 (limit: 4915)CGroup: /system.slice/monit.service└─2305 /usr/bin/monit -c /etc/monit/monitrcJul 09 15:55:42 debian systemd[1]: Stopped LSB: service and resource monitoring daemon.Jul 09 15:55:42 debian systemd[1]: Starting LSB: service and resource monitoring daemon...Jul 09 15:55:42 debian monit[2298]: Starting daemon monitor: monit.Jul 09 15:55:42 debian systemd[1]: Started LSB: service and resource monitoring daemon. |
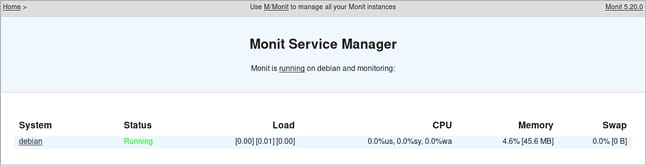
You can now open the URL http://192.168.122.197:2812 in a browser on the host system to see the default Monit home page, as shown in Figure 1.
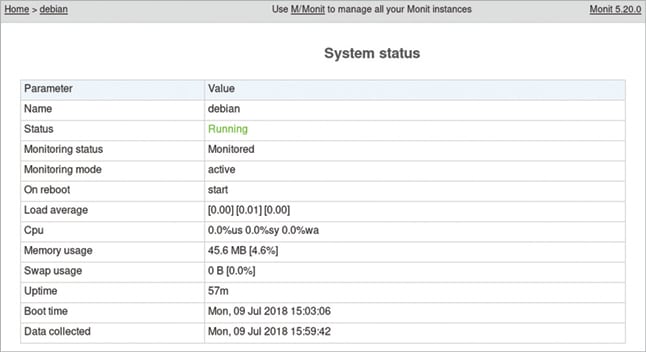
When you click on ‘debian’ under the System column, a more detailed status output is made available, as shown in Figure 2.

SSH
We can now set up Monit to monitor the SSH daemon running inside the VM. A check block for SSH needs to be added to the Monit configuration file and the service needs to be restarted. The Ansible playbook with the required SSH monitoring configuration is given below:
- name: Configure monitoring for nginx hosts: debian become: yes become_method: sudo gather_facts: true tags: [ssh]tasks: - name: Add ssh monitoring blockinfile: path: /etc/monit/monitrc marker_begin: “ssh BEGIN” marker_end: “ssh END” block: | check process sshd with pidfile /var/run/sshd.pid group system group sshd start program = “/etc/init.d/ssh start” stop program = “/etc/init.d/ssh stop” if failed host localhost port 22 with proto ssh then restart if 5 restarts with 5 cycles then timeout depend on sshd_bin depend on sshd_rc depend on sshd_rsa_key depend on sshd_dsa_key check file sshd_bin with path /usr/sbin/sshd group sshd include /etc/monit/templates/rootbin check file sshd_rsa_key with path /etc/ssh/ssh_host_rsa_key group sshd include /etc/monit/templates/rootstrict check file sshd_dsa_key with path /etc/ssh/ssh_host_ecdsa_key group sshd include /etc/monit/templates/rootstrict check file sshd_rc with path /etc/ssh/sshd_config group sshd include /etc/monit/templates/rootrc- name: Restart monit servicesystemd: name: monit.service state: restarted |
The above playbook can be invoked as follows:
$ ansible-playbook -i inventory/kvm/inventory playbooks/configuration/monit.yml --tags ssh -vv -K |
The Monit status command in the command line now produces a more detailed output on monitoring the SSH daemon as shown below:
$ sudo monit statusMonit 5.20.0 uptime: 0mProcess ‘sshd’ status Running monitoring status Monitored monitoring mode active on reboot start pid 381 parent pid 1 uid 0 effective uid 0 gid 0 uptime 1h 6m threads 1 children 5 cpu 0.0% cpu total 0.0% memory 0.6% [6.2 MB] memory total 3.3% [33.2 MB] port response time 7.847 ms to localhost:22 type TCP/IP protocol SSH data collected Mon, 09 Jul 2018 16:09:09 File ‘sshd_bin’ status Accessible monitoring status Monitored monitoring mode active on reboot start permission 755 uid 0 gid 0 size 772.5 kB timestamp Thu, 05 Apr 2018 13:18:00 checksum 0c4b6da99164fb9a9291966b1c5b9902 (MD5) data collected Mon, 09 Jul 2018 16:09:09 File ‘sshd_rsa_key’ status Accessible monitoring status Monitored monitoring mode active on reboot start permission 600 uid 0 gid 0 size 1.6 kB timestamp Thu, 05 Apr 2018 13:18:18 checksum de068898089f42cd3ada992e18af4a23 (MD5) data collected Mon, 09 Jul 2018 16:09:09 File ‘sshd_dsa_key’ status Accessible monitoring status Monitored monitoring mode active on reboot start permission 600 uid 0 gid 0 size 227 B timestamp Thu, 05 Apr 2018 13:18:18 checksum abbf249f7ca23dd6f8186072dc0173a3 (MD5) data collected Mon, 09 Jul 2018 16:09:09 File ‘sshd_rc’ status Accessible monitoring status Monitored monitoring mode active on reboot start permission 644 uid 0 gid 0 size 3.2 kB timestamp Thu, 05 Apr 2018 13:18:17 checksum bbad7ed242a834e831c7066901cee49e (MD5) data collected Mon, 09 Jul 2018 16:09:09System ‘debian’ status Running monitoring status Monitored monitoring mode active on reboot start load average [0.00] [0.00] [0.00] cpu 0.0%us 0.0%sy 0.0%wa memory usage 47.6 MB [4.8%] swap usage 0 B [0.0%] uptime 1h 6m boot time Mon, 09 Jul 2018 15:03:06 data collected Mon, 09 Jul 2018 16:09:09 |
Nginx
We can also set up Nginx on the guest VM and monitor it using Monit. The software package repository is first updated and Nginx is then installed. The service is started and we wait for it to listen on port 80. The Nginx monitoring check is then added to the Monit configuration file and the Monit service is restarted. The Ansible playbook for the above tasks is provided below, for reference:
- name: Configure ssh monitoringhosts: debianbecome: yesbecome_method: sudogather_facts: truetags: [nginx]tasks:- name: Update the software package repository apt: update_cache: yes- name: Install nginx package: name: “{{ item }}” state: latestwith_items: - nginx- name: Start nginx service: name: nginx state: started- wait_for: port: 80- name: Add nginx monitoring blockinfile: path: /etc/monit/monitrc marker_begin: “nginx BEGIN” marker_end: “nginx END” block: | check process nginx with pidfile /var/run/nginx.pid group www group nginx start program = “/etc/init.d/nginx start” stop program = “/etc/init.d/nginx stop” if 5 restarts with 5 cycles then timeout depend nginx_bin depend nginx_rc check file nginx_bin with path /usr/sbin/nginx group nginx include /etc/monit/templates/rootbin check file nginx_rc with path /etc/init.d/nginx group nginx include /etc/monit/templates/rootbin- name: Restart monit service systemd: name: monit.service state: restartedThe above playbook can be invoked as follows:$ ansible-playbook -i inventory/kvm/inventory playbooks/configuration/monit.yml --tags nginx -vv -K |
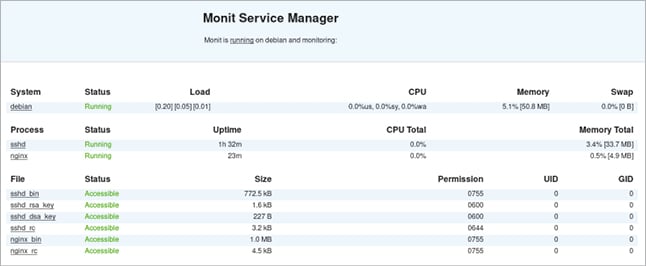
The Monit home page now contains the status of the system, the SSH daemon and the Nginx Web server, as shown in Figure 3.
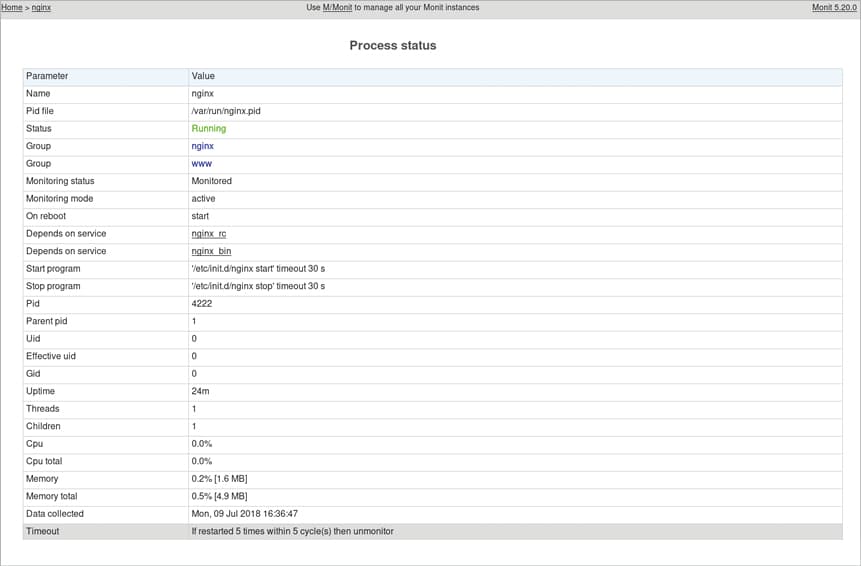
Clicking on the ‘sshd’ or ‘nginx’ link on the Monit home page provides a more detailed status page, as shown in Figures 4 and 5, respectively. You are encouraged to read the Monit manual at https://mmonit.com/monit/documentation/monit.html to learn more about its options and usage.


