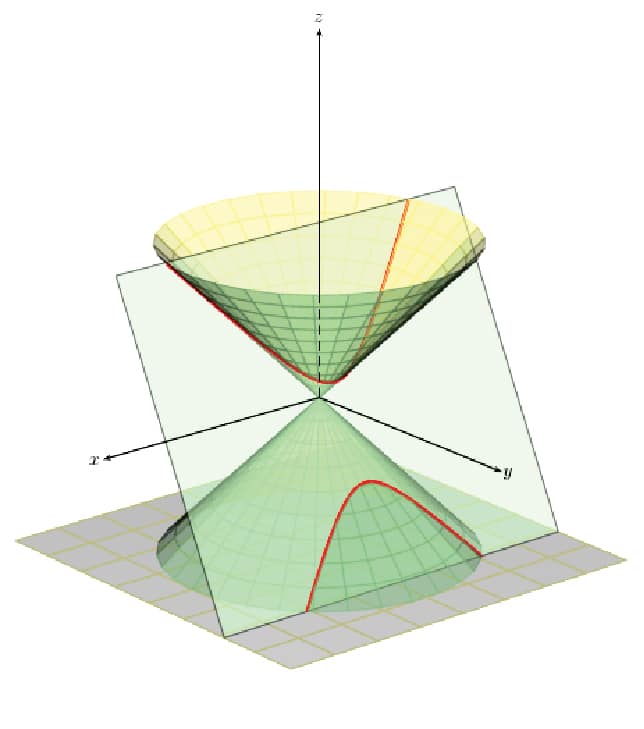
To conclude the series of three articles on Scientific Graphics Visualisation, let us explore PSTricks, a set of macros that allows the inclusion of PostScript drawings directly in Tex or LaTeX.
In this article, we will discuss PSTricks, a tool used for embedding PostScript graphics directly into LaTeX documents. PSTricks has certain drawbacks like limited output formats and incompatibility with certain LaTeX tools. The immense power offered by PostScript, however, makes it absolutely necessary for us to explore PSTricks. But before that, we need to discuss PostScript a bit.
What is PostScript?
PostScript (PS) is a page description language developed by Adobe Systems. Before the development of PostScript, plotters were used to print vector graphics, and printers were used to print raster graphics. PostScript revolutionised both electronic publishing and desktop publishing by allowing a single machine to handle both vector graphics and raster graphics, thus allowing high quality text and images to be formatted in a single page. Consider the file post1.ps with the code shown below:
newpath

200 200 moveto

300 200 lineto

300 300 lineto

200 300 lineto

200 200 lineto

2 setlinewidth

stroke
The exact meaning of this PostScript code is not important, but learning how this code works will help us understand and appreciate the advantages of PostScript and similar languages. Open the file post1.ps with a document viewer capable of displaying PostScript. You will see the image of a square. Later in the article, when we obtain more PostScript files as output of LaTeX scripts, you can open those PostScript files to see human-readable code similar to what we have seen now, but much more complicated. So, this is the philosophy of PostScript — a programming language is used to describe the image and a document viewer interprets that code to display the image. So, even if a PostScript file might appear like a page containing text and images, it actually is a file containing program code.
This approach has led to the huge success of PostScript and similar page description languages. Due to the immense popularity of PostScript, PSTricks was developed as a layer on top of it. Even though the most popular implementation of PostScript is Adobe PostScript, there is also an open source implementation of PostScript called Ghostscript, licensed under the GNU Affero General Public License.
An introduction to PSTricks
PSTricks allows us to include PostScript images directly into LaTeX and TeX documents. Unlike PGF/TikZ, which is a programming language in itself, PSTricks is a set of macros built over the language PostScript. PSTricks was originally developed by Timothy Van Zandt. High quality vector graphics images can be produced by using PSTricks. Vector graphics clearly outperform raster graphics as far as technical diagrams are concerned.
Both the advantage and disadvantage of PSTricks is its dependence on PostScript. PSTricks is very powerful and capable of producing even complex diagrams due to the power of the underlying PostScript language and because of this, PSTricks is more powerful in comparison to PGF/TikZ. But then, this over-dependence on PostScript results in a restricted set of output formats for PSTricks.
In most implementations, the only output format available with PSTricks is PostScript. This again leads to further disadvantages in PSTricks like the inability to work with certain software associated with LaTeX like pdfLaTeX, pdfTeX, etc. So, it is a bit difficult to obtain PDF output files directly from LaTeX files containing PSTricks code. There are ways to work around this and hacks to overcome this problem also. For example, pdfLaTeX can be used to process LaTeX files containing PSTricks with the help of a package called auto-pst-pdf. But this is an ugly solution and a better option is to use XeLaTeX instead of pdfLaTeX.
XeLaTeX is a replacement for pdfLaTeX, developed to overcome certain problems associated with pdfLaTeX. Even though such solutions are available, we will be discussing two easy methods to process LaTeX files containing PSTricks code, one involving the Linux terminal and the other involving Texmaker, a LaTeX editor. In both these techniques, we directly produce output files in a format other than PDF (Portable Document Format) and then use some simple tools to convert those files into PDF format. Whether you use the terminal or Texmaker, the formatted text in the output document will be the same. As a side note, XeLaTeX is available in Texmaker.
simple PSTricks example
Before moving on to our first PSTricks example, consider the simple LaTeX template shown below, which was introduced in the previous article that discussed PGF/TikZ.
\documentclass{article}

\begin{document}

% Here you can embed your PSTricks code

\end{document}
Just like PGF/TikZ code, all our PSTricks code will also be embedded inside this minimal LaTeX code for further processing. The PSTricks code inside the document environment of LaTeX is marked by the lines of code
‘\begin{document}’ and ‘\end{document}’. In the given LaTeX template, we only have a comment shown by the following line of code:
% Here you can embed your PSTricks code
…inside the document environment. Please note that LaTeX comments begin with a percentage symbol and will not be displayed in the final output document.
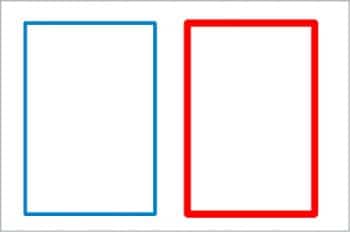
Sometimes, it is better to study a new tool by comparing its functionalities with a tool with which we are familiar. The examples provided in this article are somewhat similar to the ones we have discussed in the previous article about PGF/TikZ. But remember, even if you have missed our discussion about PGF/TikZ, it will in no way affect your learning of PSTricks. Now consider the simple LaTeX file pstricks1.tex shown below containing PSTricks code, which draws two rectangles—just like our PGF/TikZ example. This and all the other scripts discussed in this article are available for download from opensourceforu.com/article_source_code/June18PSTricks.zip.
\documentclass{article}

\usepackage{pstricks}

\begin{document}

\begin{pspicture}(15,15)

\psline[linecolor=blue,linewidth=1pt](1,1)(5,1)(5,7)(1,7)(1,1)

\pspolygon[linecolor=red,linewidth=8pt](6,1)(10,1)(10,7)(6,7)

\end{pspicture}

\end{document}
The Cartesian coordinate system of PSTricks is similar to that of PGF/TikZ. The origin denoted by (0,0) can be considered to be located at the bottom-left corner of the plane when displayed on the screen, which is similar to PGF/TikZ. The distance of any component can be measured in the number of pixels called points or in SI units of distance, say a metre or centimetre.
Now let us try to understand the working of the file pstricks1.tex. The second line of code ‘\usepackage{pstricks}’ makes sure that the functionalities of PSTricks can be used in this LaTeX script. As mentioned earlier, all the PSTricks code in a LaTeX script should be embedded inside the document environment of LaTeX marked by the commands ‘\begin{document}’ and ‘\end{document}’. All the PSTricks code to draw specific images in your LaTeX document should be embedded inside the pspicture environment marked by the commands ‘\begin{pspicture}(15,15)’ and ‘\end{pspicture}’.
The code fragment (15,15) denotes the top-right corner of the rectangle in which the PSTricks image will be drawn. The bottom-left corner can also be specified but, in this case, the default value of (0,0) is taken as this parameter. It is possible to have any number of pspicture environments inside the document environment of LaTeX — meaning a LaTeX document can contain any number of PSTricks images. The following line of code:
\psline[linecolor=blue,linewidth=1pt](1,1)(5,1)(5,7)(1,7)(1,1)
…draws five lines. The first line is drawn from point (1,1) to point (5,1), followed by a line from point (5,1) to point (5,7), followed by a line from point (5,7) to point (1,7) and, finally, a line from point (1,7) to the starting point (1,1) so that a rectangle is drawn. The code fragment:
[linecolor=blue,linewidth=1pt]
…sets the colour of the line to blue, and sets the line width to one point.
The line of code:
\pspolygon[linecolor=red,linewidth=8pt](6,1)(10,1)(10,7)(6,7)
…draws a polygon with five sides. The first line is drawn from point (6,1) to point (10,1), followed by a line from point (10,1) to point (10,7), followed by a line from point (10,7) to point (6,7) and since a polygon is closed, finally a line is drawn from point (6,7) to point (6,1) to complete the rectangle. You can use the function pspolygon to draw polygons with any number of sides. The code fragment:
[linecolor=red,linewidth=8pt]
…sets the colour of the line to red and sets the line width to eight points. As a result, the red rectangle will be drawn with thick lines, whereas the blue rectangle will be drawn with thin lines.

Now that we are familiar with the code, it is time to execute and view the output document. As mentioned earlier, we will discuss two methods to obtain output from a LaTeX file containing PSTricks code. The first method uses a LaTeX editor called Texmaker — or any other LaTeX editor for that matter. Open the LaTeX file pstricks1.tex in Texmaker and from the menu, choose Tools>LaTeX to execute pstricks1.tex to obtain the output file pstricks1.dvi. Even if you are using another LaTeX editor, you will still be able to use the tool LaTeX to process the LaTeX file — the reason is simple: any LaTeX editor will at least offer LaTeX as a tool if nothing more.
We have already discussed files with extension dvi (device independent file format) in the previous article on PGF/TikZ. We are all in need of PDF outputs but converting a DVI file containing PostScript directly to PDF will lead to errors. So, the trick is to convert the DVI file first to a PostScript file with extension ps — for which we use a tool called dvips — and then convert this PostScript file to a PDF file — for which we use a tool called ps2pdf. All you need is Texmaker.
To convert the DVI output file to PS format, choose and execute Tools>Dvi->PS. Now, to convert this output file in PS format to PDF format, choose and execute Tools>PS->PDF. For the remaining part of this article, we will only produce DVI outputs but, if necessary, the above two steps can be repeated to obtain an output file in PDF format. After the execution of these three steps, if you check the directory containing the LaTeX script pstricks1.tex, you will find three different output files, all of which contain the image shown in Figure 1. The output files are pstricks1.dvi, pstricks1.ps and pstricks1.pdf. But make sure that you have a document viewer capable of displaying all these formats and for this purpose, I recommend Okular.
The other method to obtain the output file is to use the commands latex, dvips and ps2pdf directly on the terminal. Open a terminal in the directory containing the file pstricks1.tex and execute the command ‘latex pstricks2.tex’ to obtain the output file pstricks1.dvi. Execute the command ‘dvips pstricks2.dvi’ to convert the file pstricks1.dvi to the output file pstricks1.ps in PostScript format. Execute the command ‘ps2pdf pstricks2.ps’ to convert the file pstricks1.ps to the output file pstricks1.pdf in PDF format.
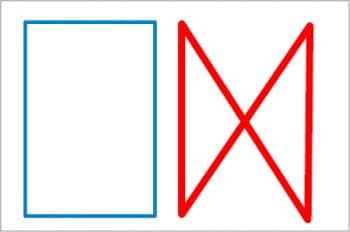
Now let us understand the function pspolygon better by making some slight modifications in the code of pstricks1.tex. What will be the output if the line of code:
\pspolygon[linecolor=red, linewidth=8pt](6,1)(10,1)(10,7)(6,7)
in pstricks1.tex is replaced with the line of code:
\pspolygon[linecolor=red,linewidth=8pt](6,1)(10,7)(10,1)(6,7)
On execution with Texmaker or in the terminal using commands, this modified file called pstricks2.tex will produce the output shown in Figure 2. But why? Well, PSTricks has just followed your instructions — that’s all. A line is drawn from point (6,1) to point (10,7) – the forward slanting line going upward; followed by a line from point (10,7) to point (10,1) — a vertical line going downward; followed by a line from point (10,1) to point (6,7) — the backward slanting line going upward. And finally, a line from point (6,7) to point (6,1) — a vertical line going downward. So, the script pstricks2.tex results in the image shown in Figure 2.
Drawing circles with PSTricks
Let us try to draw a circle using PSTricks. Consider the LaTeX script pstricks3.tex shown below which draws a circle and a square.
\documentclass{article}

\usepackage{pstricks}

\begin{document}

\begin{pspicture}(15,15)

\pspolygon[linecolor=red,fillstyle=solid,fillcolor=yellow](1,1)(3,1)(3,3)(1,3)

\pscircle[linecolor=blue,fillstyle=solid,fillcolor=green](2,2){1}

\end{pspicture}

\end{document}
Now let us go through the code in detail. In this script, all the lines of code are familiar to us except for two lines which have been newly introduced. The line of code to draw the square is:
\pspolygon[linecolor=red,fillstyle=solid,fillcolor=yellow](1,1)(3,1)(3,3)(1,3)
This line draws a square that has sides of two units. The code fragment:
[linecolor=red,fillstyle=solid,fillcolor=yellow]
…sets the line colour to red and fills the inside of the square with yellow colour. We will discuss fillstyle and the other related parameters later. The line of code to draw the circle is:
\pscircle[linecolor=blue,fillstyle=solid,fillcolor=green](2,2){1}
This line draws a circle of radius of one unit with the centre at point (2,2). The code fragment:
[linecolor=blue,fillstyle=solid,fillcolor=green]
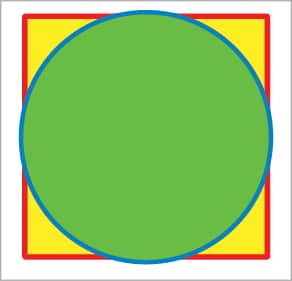
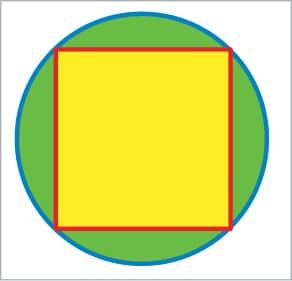
…draws the circle in blue colour and fills its interior with green colour. Since the diameter of the circle is two units and the sides of the square are also two units, the circle is inscribed inside the square. On execution with Texmaker or in terminal using commands, the file called pstricks3.tex will produce the output shown in Figure 3.
Now it is time for a simple challenge. Can you modify the file pstricks3.tex to obtain the image shown in Figure 4? All you need to do is make one or two minor changes in the file pstricks3.tex. The first thing to do is increase the radius of the green circle. What is the required radius? Well, here we have a small mathematical problem. The diameter of the required circle is √2 units because the sides of the square are of size two units. Since √2 is an irrational number, we can’t get its exact value. But we have all encountered this problem during our school days — ‘inscribe a square inside a circle’. How did we do it back then? Well, there are some Euclidean constructs that give a good approximation for the value of √2. Let us also proceed in the same manner; a good approximation for √2 is 1.414.
So, the question is this — if we replace the line of code:
\pscircle[linecolor=blue,fillstyle=solid,fillcolor=green](2,2){1}
…in pstricks3.tex with the line of code:
\pscircle[linecolor=blue,fillstyle=solid,fillcolor=green](2,2){1.414}
…are we going to get the required image as output? The answer is, ‘No!’ If you do that modification alone, you will see a circle of radius √2 drawn in blue colour filled with green colour. Why?
We encountered the same problem when we discussed PGF/TikZ. Both PGF/TikZ and PSTricks draw image components in the order in which the corresponding code appears in the script. Here, we have first drawn a square of sides 2cm and then we have drawn a circle of radius √2 over it; hence, the square is not visible. So, the second change to make is to swap the order in which the square and the circle are drawn. Then the required image will be obtained in the output file. The modified script pstricks4.tex is also available for download.
Different styles in PSTricks
So far, we have drawn images using simple lines alone. Now it is time for us to draw images in different styles and patterns. Consider the LaTeX script pstricks5.tex shown below, which draws three circles with different fill styles, line styles and newly defined colours.
\documentclass{article}

\usepackage{pstricks}

\begin{document}

\begin{pspicture}(15,15)

\psset{linewidth=0.05cm}

\newrgbcolor{col1}{1 1 0.7}

\newrgbcolor{col2}{0.7 1 1}

\newrgbcolor{col3}{1 0.7 1}

\pscircle[linestyle=solid,linecolor=red,fillstyle=vlines*,fillcolor=col1](2,2){1}

\pscircle[linestyle=dashed,linecolor=green,fillstyle=hlines*,fillcolor=col2](5,2){1}

\pscircle[linestyle=dotted,linecolor=blue,fillstyle=crosshatch*,fillcolor=col3](8,2){1}

\end{pspicture}

\end{document}
The line of code ‘\psset{linewidth=0.05cm}’ sets the line width to 0.05cm. The line of code ‘\newrgbcolor{col1}
{1 1 0.7}’ defines a new colour with name col1. A new colour is specified by providing its RGB components. The values of the RGB components should be between 0 and 1. For example, {0, 0, 0} defines black colour and {1, 1, 1} defines white colour. The next two lines of code define two more new colours named col2 and col3. The line of code ‘\pscircle[linestyle=solid,linecolor=red,fillstyle=vlines*,fillcolor=col1](2,2){1}’ draws a circle with the border in red solid line, filled with the colour defined by the variable col1 and with fillstyle vlines* filling the inside of the circle by drawing backward slanting lines.
The next line of code draws a circle with a border in a green dashed line, filled with the colour defined by the variable col2 and with fillstyle hlines* filling the inside by drawing forward slanting lines. And the following line of code draws a circle with the border in a blue dotted line, filled with the colour defined by the variable col3 and with fillstyle crosshatch* filling the inside of the circle by drawing a mesh. On executing the program, pstricks5.tex will produce the image shown in Figure 5 as output. Can you modify the code in such a way that the filled colours of the circles are yellow, magenta and cyan? I will give you a hint. Adding red and green gives yellow, adding red and blue gives magenta, and adding green and blue gives cyan. So, what should be the colour codes and where should we make the changes? If you are unable to get the answer to this problem, please download and execute the script pstricks6.tex.
Loops in PSTricks
You are tasked with developing the network topology diagram of your office LAN. The diagram uses a circle to denote a computer in your office LAN and you are working in a large company with hundreds of computers. How will you draw the circles in your diagram? Well, you don’t have to draw each and every one of those circles manually. PSTricks offers very powerful looping and control structures to help you draw a large number of similar images very easily. Consider the LaTeX file pstricks7.tex shown below:
\documentclass{article}

\usepackage{multido}

\usepackage{pstricks}

\begin{document}

\begin{pspicture}(10,10)

\multido{\ia=0+1}{3}

{

\multido{\ib=0+1}{3}

{

\rput(\ia,\ib){\pscircle[linecolor=red,fillstyle=solid,fillcolor=blue]{0.4}}

}

}

\end{pspicture}

\end{document}
Let us go through the code in detail to understand PSTricks loops better. There are different ways to use loops in PSTricks, but we will discuss only one such technique which uses a macro called multido. The line of code
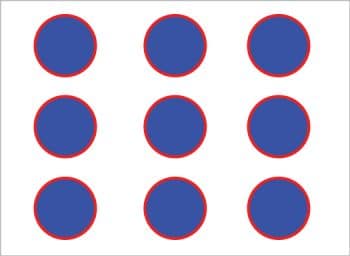
‘\usepackage{multido}’ allows us to use the functionalities of the macro multido. The line of code ‘\multido{\ia=0+1}{3}’ defines an outer loop that gets executed three times. Similarly, the line of code ‘\multido{\ib=0+1}{3}’ defines an inner loop that gets executed three times. So the line of code ‘\rput(\ia,\ib){\pscircle[linecolor=red,fillstyle=solid,fillcolor=blue]{0.4}}’ inside the inner loop gets executed for a total of nine times. The macro rput is used here to set the reference point. In this case, the reference points are specified by the loop variables ia and ib, both of which are initialised to zero and get incremented by 1. Due to this reason, the centres of the nine circles with radius of 0.4 units drawn by the code fragment ‘pscircle[linecolor=red,fillstyle=solid,fillcolor=blue]{0.4}’ are different. On executing the script, pstricks7.tex will produce the image shown in Figure 6 as output.
Now let us make a small modification to the file pstricks7.tex to have a glimpse of the real power of PSTricks. The line of code:
\multido{\ia=0+1}{3}
…is replaced with the line of code:
\multido{\ia=0+1}{10}
…and the line of code:
\multido{\ib=0+1}{3}
…is replaced with the line of code:
\multido{\ib=0+1}{10}
… in pstricks7.tex to obtain the file pstricks8.tex. On execution, the script pstricks8.tex will produce an image containing 100 circles, each with a radius of 0.4 units. All we did to change an image showing nine circles to an image showing 100 circles is modify just two parameters in maybe 30 seconds! Imagine how much time would have been taken by normal image manipulation software to make a similar change.
So, once you overcome the initial difficulties of learning tools like PSTricks and PGF/TikZ, they will save you a lot of time and effort when compared to conventional image manipulation tools. This is yet another advantage of PSTricks and PGF/TikZ.
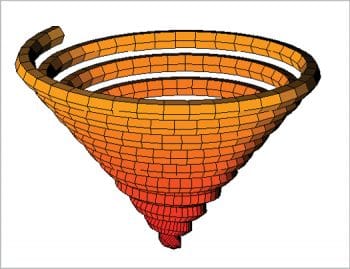
One of the most powerful aspects of PSTricks is its ability to produce 3D graphics. Due to the complexity in understanding the topic, it has not been discussed in this article. But to give you an idea about the 3D plotting capabilities of PSTricks, I have included a 3D plot generated by PSTricks. To work with 3D plots in PSTricks, you need to have some additional files installed in your system or placed in the same directory containing your .tex file that generates 3D plots. The files are pst-solides3d.pro, pst-solides3d.sty and pst-solides3d.tex. The plot in Figure 7 is obtained from a slightly modified version of a file called exa062.tex provided by the official PSTricks website of the TeX Users Group.
If you are really interested in PSTricks, I suggest that you explore the website https://tug.org/PSTricks/main.cgi/, which is full of PSTricks example files and tutorials that will guide you through to mastery.


