This is the second article in a three-part series on scientific graphics visualisation. It covers PGF/TikZ software, which is free and open source. It also touches upon graphics file formats, LaTeX and PSTricks.
In the first part on this series on scientific graphics visualisation, we discussed Matplotlib, a plotting utility for Python. In this article, we will discuss PGF/TikZ, a pair of languages used for creating vector graphics. Maybe it is time to discuss, in detail, the differences between vector graphics and raster graphics.
Raster graphic images are made of pixels, which are the smallest element in a display device. If you zoom your raster image indefinitely, then at some point you will start seeing a lot of tiny dots. The quality of the image goes down as you keep zooming further. Some of the common raster image formats include JPEG, TIFF, GIF, BMP, PNG, etc. Vector images, on the other hand, are drawn with the help of vector software, with lines and shapes. The vector graphic image will always look the same, even when zoomed to very large sizes. Some of the popular vector graphics formats include AI (Adobe Illustrator), EPS (Encapsulated PostScript), SVG (Scalable Vector Graphics), etc. Due to the high quality of the images, it is always better to use vector graphics over raster graphics for technical diagrams.
A brief introduction to LaTeX
Though PGF/TikZ can be used with ConTeXt and the original TeX, it is most extensively used with LaTeX. So, a brief introduction to LaTeX is absolutely essential before proceeding with PGF/TikZ. Due to this close relationship between the two, PGF/TikZ can be considered as a LaTeX package for programming graphics. LaTeX is a very popular cross-platform document-preparation system. It is free and open source software licensed under the LaTeX Project Public License (LPPL). LaTeX was developed by Leslie Lamport. It is based on TeX, a typesetting system developed by Donald Knuth.
Very often people consider LaTeX and TeX as one and the same, but this is not true. The fundamental difference between the two can be understood with the following example. Consider TeX as a programming language with no built-in functions and LaTeX as an extension to this language containing a lot of built-in functions. Generally, we can say that TeX is far more difficult to learn and use when compared with LaTeX. A TeX distribution such as TeX Live is often used in the Linux environment to obtain the services of LaTeX. While preparing documents with LaTeX, commands are used instead of formatting the text to get special effects like bold, italics, etc. For example, in word processing packages like LibreOffice Writer or Microsoft Word, you will see text in bold or italics; whereas in a LaTeX file you will only see commands like \textbf or \textit to provide the same effect. After processing this LaTeX file, you will get an output document, which will show the formatted text.
Usually, on execution, LaTeX files produce PDF (Portable Document Format) or DVI (device independent file format) files as output. Consider the simple LaTeX script ‘Hello.tex’ shown below, containing only the absolutely essential features of LaTeX. This LaTeX script and all the other PGF/TikZ scripts discussed in this article can be downloaded from opensourceforu.com/article_source_code/May18graphicsvisualisation.zip.
\documentclass{article}

\begin{document}

\textbf{\textit{Hello World}}

\end{document}
From the name Hello.tex itself it is clear that the extension of a LaTeX file is tex. We use this LaTeX file as a template for executing all the PGF/TikZ code discussed in this article. First, let us go through this minimal LaTeX example, line by line. The line of code \documentclass{article} defines the document class as an article. Some other document classes provided by LaTeX include letter, book, report, beamer, etc. I believe that except for the document class beamer, which is used to create presentations using LaTeX, the purpose of all the other document classes mentioned here is clear from their names itself. The lines of code \begin{document} and \end{document} define the area in which the actual data of the output document can be given. In this case, we only have one line of code in the content part of the LaTeX document, \textbf{\textit{Hello World}}. This line tells the LaTeX interpreter to print the text ‘Hello World’ in bold and italics.
So, now we have a LaTeX file ready with us to be executed, but what is the best way to process it? There are different ways to process LaTeX files. For example, you can use Overleaf, a collaborative writing and publishing system that can process LaTeX code. But, in this article, I will be exploring two other methods to process LaTeX.
First, let’s execute the LaTeX interpreter from the terminal. Open a terminal in the directory containing the LaTeX file Hello.tex and execute the command latex Hello.tex. On execution, the LaTeX file will produce a document called Hello.dvi with the text ‘Hello World’ printed in bold and italics. The default output format of LaTeX is DVI. If you want the output file in PDF format, execute the following command on the terminal pdflatex Hello.tex, which will use an extension of LaTeX called pdfLaTeX to produce the output file Hello.pdf with the same content as the other output file Hello.dvi.
The second method is to use a LaTeX editor like Texmaker, a popular free and open source cross-platform LaTeX editor with an integrated PDF and DVI viewer. Open the LaTeX file Hello.tex in Texmaker and, in the menu, you will find Tools>LaTeX and Tools>PDFLaTeX to execute LaTeX and its extension pdfLaTeX. Whether you use the tool LaTeX, pdfLaTeX or Texmaker, the formatted text in the output document will be the same. Even though Texmaker has the built-in option to view PDF and DVI output files, make sure that your system has a document viewer like Okular that is capable of displaying DVI and PDF files so that the documents can be viewed directly. There are many other LaTeX editors like TeXstudio, TeXworks, Kile, etc. Using Texmaker is just a personal choice, and I encourage you to try out any of the other LaTeX editors that are available and then stick with the one you like the most. Also, remember that sometimes you need to process the LaTeX file multiple times to obtain the correct labels, bibliography, index, etc.
One problem that often confuses new users of LaTeX is the large number of supporting files generated by it. If you observe the directory containing the file Hello.tex, you will see files called Hello.aux and Hello.log, apart from the output files Hello.pdf and Hello.dvi. And as your LaTeX document becomes more and more complex, the number of such files created also increases. I am not going to explain the purpose of these supporting files in this article, but you don’t need to worry because out of the large number of files created, you only need to worry about the LaTeX file with the extension tex and the output files with extensions pdf and dvi. All other files can be regenerated by executing the LaTeX interpreter.
An introduction to PGF/TikZ
Now that we are familiar with how LaTeX works, let us talk about PGF/TikZ, which was developed by Till Tantau, using the software, TeX. As mentioned earlier, it is not a single tool but two separate languages paired together to produce high quality vector graphics. PGF is the lower-level language and TikZ is a set of higher-level macros that use PGF. The relationship between PGF and TikZ is somewhat similar to the relationship between TeX and LaTeX, the former stating the basic syntax and the latter providing macros for ease of use.
TikZ was first introduced with version 0.95 of PGF. The latest version of PGF/TikZ is 3.0.1 released in August 2015. PGF is the acronym for ‘portable graphics format’. TikZ is a recursive acronym for ‘TikZ ist kein Zeichenprogramm’, German for ‘TikZ is not a drawing program’ — asserting the fact that these are programming languages capable of powerful functions. Unlike the other popular graphics visualisation tool called PSTricks, which uses a syntax resembling PostScript, PGF and TikZ describe the images to be drawn by using a syntax that resembles MetaPost, a language that is used to produce vector graphic diagrams.
This over-dependence of PSTricks on PostScript is an advantage and disadvantage at the same time. The disadvantages of PSTricks include the limited output formats it offers (PSTricks can only produce PostScript output and not PDF output) and incompatibility with some associated tools of LaTeX like pdfTeX. But PGF/TikZ is able to produce both PostScript and PDF output and has a high level of compatibility with all the tools associated with LaTeX, which makes some knowledge of PGF/TikZ very essential.
A simple PGF/TikZ example
PGF/TikZ produces vector graphics from a geometric description of the image to be drawn by using its own set of instructions. Before exploring the code any further, let us discuss two important aspects of PGF/TikZ, which are points and paths. Points refer to a specific location in a two-dimensional plane. Points can be specified as Cartesian coordinates, polar coordinates, named points and relative points in PGF/TikZ. To make our discussion relatively simple and less mathematical, we will only discuss the points being described as Cartesian coordinates. For example, the Cartesian coordinates (p, q) refer to a point located at p units in the direction of the x-axis and q units in the direction of the y-axis. For ease of understanding, the origin denoted by (0,0) can be considered as located at the bottom-left corner of the plane when displayed on the screen.
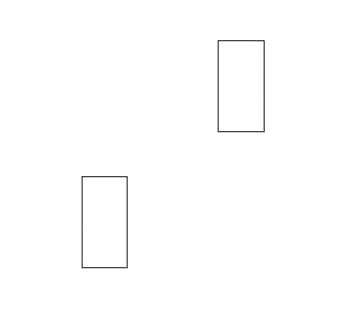
The other important aspect of PGF/TikZ is how a path is traced in a two-dimensional plane. This aspect of tracing paths in PGF/TikZ is explained with the following example scripts. Let us start with a simple example involving PGF/TikZ code to understand how paths are specified. Consider the LaTeX script pgf1.tex shown below, which draws two rectangles. As stated earlier, the PGF/TikZ code is incorporated inside the minimal LaTeX template mentioned earlier.
\documentclass{article}

\usepackage{tikz}

\begin{document}

\begin{tikzpicture}

\draw (1,1)--(2,1)--(2,3)--(1,3)--cycle;

\draw (4,4)rectangle(5,6);

\end{tikzpicture}

\end{document}
Now let us go through the code in the file pgf1.tex, line-by-line, to understand it better. I will only explain the lines of code newly introduced in this script. The line of code \usepackage{tikz} makes sure that LaTeX can use all the functionalities of the package TikZ. The lines of code \begin{tikzpicture} and \end{tikzpicture} denote the environment inside which PGF/TikZ code can be entered to draw images. The line of code \draw (1,1)–(2,1)–(2,3)–(1,3)–cycle; draws four lines in the two-dimensional plane by using the draw command. The first line is drawn from point (1,1) to point (2,1), the second line is drawn from point (2,1) to point (2,3), the third line is drawn from point (2,3) to point (1,3), and the fourth line is drawn from point (1,3) to point (1,1). The portion of the code that is responsible for drawing the fourth line is (1,3)–cycle; which will complete the rectangle by drawing a line from point (1,3) to the first point used in this draw command, which is point (1,1).
The line of code \draw (4,4)rectangle(5,6); draws a rectangle by providing the location of the bottom-left and top-right corners of the rectangle. In this case, the points are (4,4) and (5,6), respectively which represent these two corners. Please note the fact that PGF/TikZ commands are terminated with a semicolon (;), failing which they will lead to an error. Now let us execute this script to view the image drawn. This LaTeX script can also be executed like any other ordinary LaTeX document — either use the command pdflatex or latex on a terminal or use Texmaker. I have used the command pdflatex pgf1.tex on the terminal to produce the output file pgf1.pdf. Figure 1 shows the image in the document pgf1.pdf.
Coloured images with PGF/TikZ
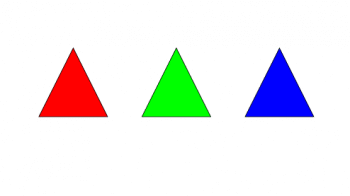
It is very easy to draw coloured images with PGF/TikZ. Consider the script pgf2.tex given below. In this script, three triangles are drawn in red, green and blue.
\documentclass{article}

\usepackage{tikz}

\begin{document}

\begin{tikzpicture}

\draw[fill=red] (0,1)--(2,1)--(1,3)--cycle;

\draw[fill=green] (3,1)--(5,1)--(4,3)--cycle;

\draw[fill=blue] (6,1)--(8,1)--(7,3)--cycle;

\end{tikzpicture}

\end{document}
The only line of code that needs an explanation is \draw[fill=red] (0,1)–(2,1)–(1,3)–cycle;. This line draws a triangle by drawing three lines. The first line is drawn from point (0,1) to point (2,1), the second line is drawn from point (2,1) to point (1,3), and the third line is drawn from point (1,3) to point (0,1), thus forming a triangle. The colour to be filled inside the triangle is provided as an option to the draw command. The option to fill the triangle with red colour is given by the code [fill=red]. The remaining two lines in the tikzpicture environment of LaTeX draw two more triangles, and fill them with green and blue. On executing the command pdflatex pgf2.tex, an output file called pgf2.pdf will be generated. Figure 2 shows the image in the document pgf2.pdf.
There are other options also available with the draw command. For example, there are options to change the colour of the line from the default black; to vary the thickness of the line being drawn, etc. Replace the three lines of code inside the tikzpicture environment of the script pgf2.tex with the lines of code \draw[yellow, very thick, fill=red] (0,1)–(2,1)–(1,3)–cycle;, \draw[yellow, very thick, fill=green] (3,1)–(5,1)–(4,3)–cycle; and \draw[yellow, very thick, fill=blue] (6,1)–(8,1)–(7,3)–cycle; to obtain pgf3.tex. On executing the command, pdflatex pgf3.tex, this script will produce an output document named pgf3.pdf, which has three triangles drawn with thick yellow coloured lines and filled with red, green and blue colour. The script pgf3.tex is also available for download.
Drawing circles with PGF/TikZ
Now let us look at how to draw circles using PGF/TikZ. Consider the script pgf4.tex shown below.
\documentclass{article}

\usepackage{tikz}

\begin{document}

\begin{tikzpicture}

\draw[fill=red] (0,0) circle (4cm);

\draw[fill=green] (0,0) circle (3cm);

\draw[fill=blue] (0,0) circle (2cm);

\draw[fill=orange] (0,0) circle (1cm);

\end{tikzpicture}

\end{document}
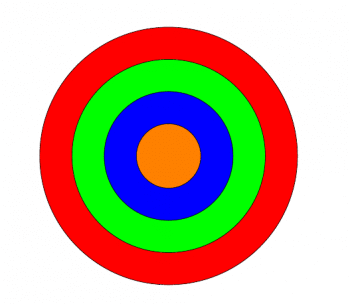
The only line of code that requires an explanation is \draw[fill=red] (0,0) circle (4cm);. This line draws a red circle of radius 4cm with its centre at point (0, 0) and fills this circle with red colour. The remaining three lines in the tikzpicture environment of LaTeX draw three more circles with a radius of 1cm less than the previous one and with the centre at the same point, so that we have four concentric circles drawn in the final output file. On executing the command pdflatex pgf4.tex in a terminal, four concentric circles are drawn in red, green, blue and orange colours. Figure 3 shows the output of the script pgf4.tex.
Remember that components of an image with multiple layers are drawn in the order in which the line of code corresponding to a particular component appears in the tikzpicture environment of LaTeX. In the previous example (pgf4.tex), the red circle with a radius of 4cm is drawn first, then the green circle with a radius of 3cm, followed by the blue circle with a radius of 2cm and finally the orange circle with a radius of 1cm. For a better understanding, let us modify the script pgf4.tex in such a way that the circles are drawn in the reverse order — the smallest circle is drawn first and so on — to obtain pgf5.tex. Now, what will be the image drawn in the output document pgf5.pdf when this modified LaTeX file pgf5.tex (shown below) is executed with the command pdflatex pgf5.tex?
\documentclass{article}

\usepackage{tikz}

\begin{document}

\begin{tikzpicture}

\draw[fill=orange] (0,0) circle (1cm);

\draw[fill=blue] (0,0) circle (2cm);

\draw[fill=green] (0,0) circle (3cm);

\draw[fill=red] (0,0) circle (4cm);

\end{tikzpicture}

\end{document}
You might be a bit surprised to see that a single red circle with a radius of 4cm alone is drawn in the output file pgf5.pdf. I assure you, we didn’t do anything wrong. It’s just the way PGF/TikZ works. Try to find out the reason for this abnormal behaviour. If you are unable to find an answer, I have added it as a comment in the file pgf5.tex available for download.
Loops in PGF/TikZ
So far, we have drawn two rectangles, three triangles and four circles. What happens if we are asked to draw a hundred triangles or a thousand circles? Well, that’s why we have loops in PGF/TikZ to help us. PGF/TikZ has many efficient looping and control structures to help us draw a large number of images with relative ease. Consider the example script pgf6.tex shown below, which uses the foreach loop provided by PGF/TikZ.
\documentclass{article}

\usepackage{tikz}

\begin{document}

\begin{tikzpicture}

\foreach \x in {1,2,...,9} {

\foreach \y in {1,2,3} {

\draw[fill=red!\x\y!green] (\x,\y) circle (4mm);

}

}

\end{tikzpicture}

\end{document}
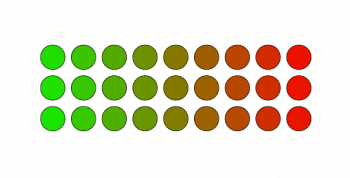
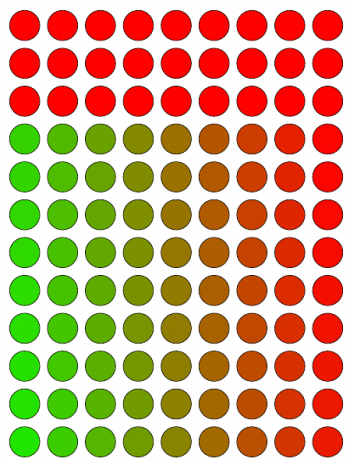
The line of code \foreach \x in {1,2,…,9} { defines an outer loop that iterates nine times. The line of code \foreach \y in {1,2,3} { defines an inner loop that iterates three times. Thus the line of code \draw[fill=red!\x0!green] (\x,\y) circle (4mm); inside the inner loop gets executed for a total of 27 times and, therefore, draws 27 circles that each have a radius of 4mm. The centres of these circles are defined by the code fragment (\x \y). Therefore, the centres are not fixed — they are the points (1,1), (1,2), (1,3), (2,1), (2,2), (2,3), …, (9,1), (9,2) and (9,3), a total of 27 points in the two-dimensional plane as the values of variables x and y change inside the outer and inner loops.
The code fragment [fill=red!\x\y!green] defines the colour filled inside the circles. The code fragment red!40!green defines a circle that has 40 per cent red and the remaining 60 per cent green. So, in this case, since the values of the variables x and y change inside the loops, no two circles will have the same colour. But it may not be possible to identify the difference in colour between a circle having 11 per cent red and 89 per cent green, and another circle with 12 per cent red and 88 per cent green. That is the reason why some of the adjacent circles may look similar in colour. On executing the command pdflatex pgf6.tex the LaTeX file pgf6.tex will produce an output file titled pgf6.pdf with the image shown in Figure 4.
Let us change just a single line of code in the file pgf6.tex to obtain pgf7.tex. The line of code \foreach \y in {1,2,3} { in pgf6.tex is replaced with the line \foreach \y in {1,2,…,12} { in pgf7.tex. On executing the file pgf7.tex with the command pdflatex pgf7.tex, you will get an output file titled pgf7.pdf with the image shown in Figure 5. A few characters are added to a single line of code and the image changes drastically. I believe this example clearly illustrates the benefit of using graphical programming tools like PGF/TikZ and PSTricks rather than conventional image design software. Imagine how much time it would take to draw a technical diagram similar to the one we have discussed, with a lot of image components placed at specific locations, if we had used typical image design software.
Now it is time to wind up our discussion. You should now be able to write and execute LaTeX scripts embedded with PGF/TikZ scripts to produce a DVI or a PDF file as output, either by using LaTeX or pdfLaTeX in the terminal or by using the popular LaTeX editor Texmaker. We have left out a few important topics like three-dimensional plotting, plotting in the beamer document class of LaTeX, etc, but the introduction given in this article will definitely provide you with a head start over others. In my opinion, PGF/TikZ is a powerful weapon in the hands of professionals who need to produce good quality technical diagrams.
Why learn PSTricks?
PSTricks is yet another powerful scientific graphics visualisation tool used along with LaTeX. One last question I want to answer before concluding this article is, ‘Why learn PSTricks if PGF/TikZ is so great?’ Well, PGF/TikZ is definitely a great tool but PSTricks also has something good to offer. As mentioned earlier, PSTricks is associated with PostScript, a very powerful page description language. The programming power offered by PostScript makes it absolutely essential that I should also introduce PSTricks, so that potential users can experiment with both PGF/TikZ as well as PSTricks, and then make an informed decision regarding their choice for a good visualisation tool for LaTeX. So, in the next and final part of this series on scientific graphics visualisation, we will discuss PSTricks.


