Debugging code is an essential part of the program development cycle, and debugging Java applications has its own special problems. In this article, the author analyses the causes of problems in Java code, and suggests ways and means to debug them.
Java programs are always complex to debug and analyse due to their versatility in supporting a lot of features, platforms, etc. When writing Java programs, one of the primary concerns the developer has to address is the provision of a debug facility for future use, to solve any problem that may occur in a test environment or even in a real-time client environment.
The debugging facility would depend on the types of problems that might arise during Java program execution. These problems would depend upon:
1. Features used (like device interface, external connectivity like file handling, database usage)
2. Concept implemented/linked (like RMI, JDBC, threads, communication with other Java programs)
3. GUI facility
4. User interaction with a utility, script, GUI, etc
5. Compatibility (like the OS handled, JDK version supported, etc)
Classification of Java problems
Based on these factors and other minor categories, we can classify problems in Java applications as follows:
1. Memory related problems
2. Synchronisation/thread related issues
3. Communication related problems (backend, interface and GUI)
4. Problems related to the database, connectivity and file handling
5. Issues linked to the boundary condition
6. Native/JNI related issues
7. Problems associated with the OS/environment
How to identify the problem
Typical problems that occur in a running Java program are: the program does not respond, aborts abnormally, displays exceptions or error messages in the console/GUI, the GUI freezes or grays out, the program crashes and a core dump occurs, or any other unexpected/abnormal behaviour.
In such cases, debugging and finding out the reason and solution for the problem is a tough task. In general, the coder has to write the program/application in a way that either such problems can be bypassed, or each activity (milestone) with all possible information is recorded during its runtime so that it can help in identifying the cause of the current problem.
This can be done with the help of the following:
1. Log files
2. Stack trace, dump trace output
3. Logging information in the database during each stage
4. Console output
5. Message boards and error messages
6. Dialogue boxes and information windows showing the current status
Log files
What’s most useful when diagnosing any type of Java problem is the information that we get from log files, which serves as first hand details for identifying the problem at hand.
Keeping this in mind, code should be written in such a way that the log files give the maximum possible details. This is how log files become the main source in helping anyone to understand the execution flow.

The log files can give details like the method flow, values used and exceptions occurred during execution. Based on the type of display, logging can be classified as follows.
1. Console logging: This will print the log in the console, where the Java program is started. If the program is a GUI that runs from the browser, then the browser console can be used to print the log details. In non-Windows platforms like UNIX, we can start the program in the background so that when we print the console logs in these platforms, we cannot see them. Hence, in these platforms, it is better to redirect the program’s console output (logging) to a file itself.
2. File logging: We can do exhaustive logging in files by directly using streams in Java code or using the facility from tools like log4j [http://logging.apache.org/log4j/docs/].
In the Java language, where a preprocessor is not available, log statements increase the size of the code and reduce its speed, even when logging is turned off. Given that a reasonably sized application may contain thousands of log statements, speed is of particular importance.
Hence, we have to make the logging configurable or have logging with categories like the following:
- An INFO log, which gives the general method flow, entry/exit of the method, branching, etc.
- A DEBUG log, which gives the values for objects, object creation details, etc.
- A WARNING log, where we bypass minor errors like taking the default value when the given value does not satisfy the boundary conditions, the exception to which will not affect the executing flow, etc.
- An ERROR log, which gives the fatal errors during execution. Fatal errors for a Java program can be environmental errors, communication errors, database logging errors, IO errors, device handling problems, etc.
We can make logging configurable to enable/disable it at runtime without modifying the application binary. Logging behaviour can be controlled by editing a configuration file, without touching the application binary for this behaviour.
Logging equips the developer with a detailed context for application failures. On the other hand, testing provides quality assurance and confidence in the application. Logging and testing should not be mistaken for each other. They are complementary. When logging is wisely used, it can prove to be an essential tool.
Using Stacktrace to debug code
While coding or debugging, we can make use of Stacktrace to analyse problems. While coding, we can do this using the printStackTrace() method as follows:
try

{

<do something>

}

catch(Exception ex)

{

ex.printStackTrace();

}
When we run the above code, we will get a trace output from the stack that looks somewhat like what follows:
java.lang.Exception

at Excep1.main(Excep1.java:57)

at sun.rmi.server.UnicastServerRef.dispatch(Unknown Source)

at sun.rmi.transport.Transport.serviceCall(Unknown Source)

at sun.rmi.transport.tcp.TCPTransport.handleMessages(Unknown Source)

at sun.rmi.transport.tcp.TCPTransport$ConnectionHandler.run(Unknown Source)

at java.lang.Thread.run(Unknown Source)
Note: While debugging Java code, we can use Stacktrace to find the flow of method calls during normal execution using the dumpStack() method in the thread class.
Deadlock
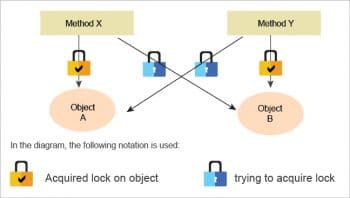
By definition, deadlock is a critical situation that occurs in a running Java process, when there is a conflict state where two or more synchronised Java objects depend on locking each other, but cannot, because they themselves are locked by the dependent object.
In Figure 1, Object A tries to lock Object B while the latter is trying to lock the former. This situation is difficult to debug, because a pre-emptive Java virtual machine can neither detect nor prevent the deadlock.
When the deadlock takes place, the Java program usually hangs. In such a situation, we take a thread dump, whereby we can see the deadlock problem at the end of the thread dump, as shown below:
Found one Java-level deadlock:

=============================

“Thread-1”:

waiting to lock monitor 0x0091a27c (object 0x140fa790, a java.lang.Class),

which is held by “Thread-0”

“Thread-0”:

waiting to lock monitor 0x0091a25c (object 0x14026800, a java.lang.Class),

which is held by “Thread-1”

Java stack information for the threads listed above:

===================================================

“Thread-1”:

at Deadlock$2.run(Deadlock.java:48)

- waiting to lock <0x140fa790> (a java.lang.Class)

- locked <0x14026800> (a java.lang.Class)

“Thread-0”:

at Deadlock$1.run(Deadlock.java:33)

- waiting to lock <0x14026800> (a java.lang.Class)

- locked <0x140fa790> (a java.lang.Class)

Found 1 deadlock.
Tools like JProfiler, OptimizeIT thread analyser or Samurai are very helpful in analysing a thread dump for any problems and deadlock.
Profiling Java applications
There are specific problems in Java such as high resource consumption—high CPU usage, memory usage, network usage, etc. For these kinds of problems, we have to use the facility of profiling. This measures the performance of the application during runtime by attaching a monitoring tool that gathers vital data on memory usage by each of the objects, and on the instances, the CPU usage and network usage of the running Java application.
For profiling, a lot of tools are available like OptimizeIT, JProfiler, HP-JMeter, etc. OptimizeIT is a very flexible tool that uses the JVMPI facility to profile Java applications. Along with a thread analyser, this tool offers a comprehensive set of features.
JProfiler is an easy-to-use tool for profiling/monitoring remote applications and consumes less memory. With various reporting and snapshot features, this tool can prove to be a very good offline analyser tool.
When our Java programs use the native coding facility (C or C++) like a JNI call or a native call, we may need to monitor native profiling also. For this, we can make use of tools like Insure++, LTProf, etc.
Analysing Java programs for troubleshooting is an interesting yet complex task; but it can be made simple by using the proper methods. When writing code, we have to keep in mind the possible problems that can arise during runtime, and implement features like logs, console output, error messages, etc, so that when any problem occurs, we can easily identify and solve it. Also, we have to write the code such that minor problems (like boundary/NULL handling) are bypassed and more details are given to the user when major problems are encountered.


