


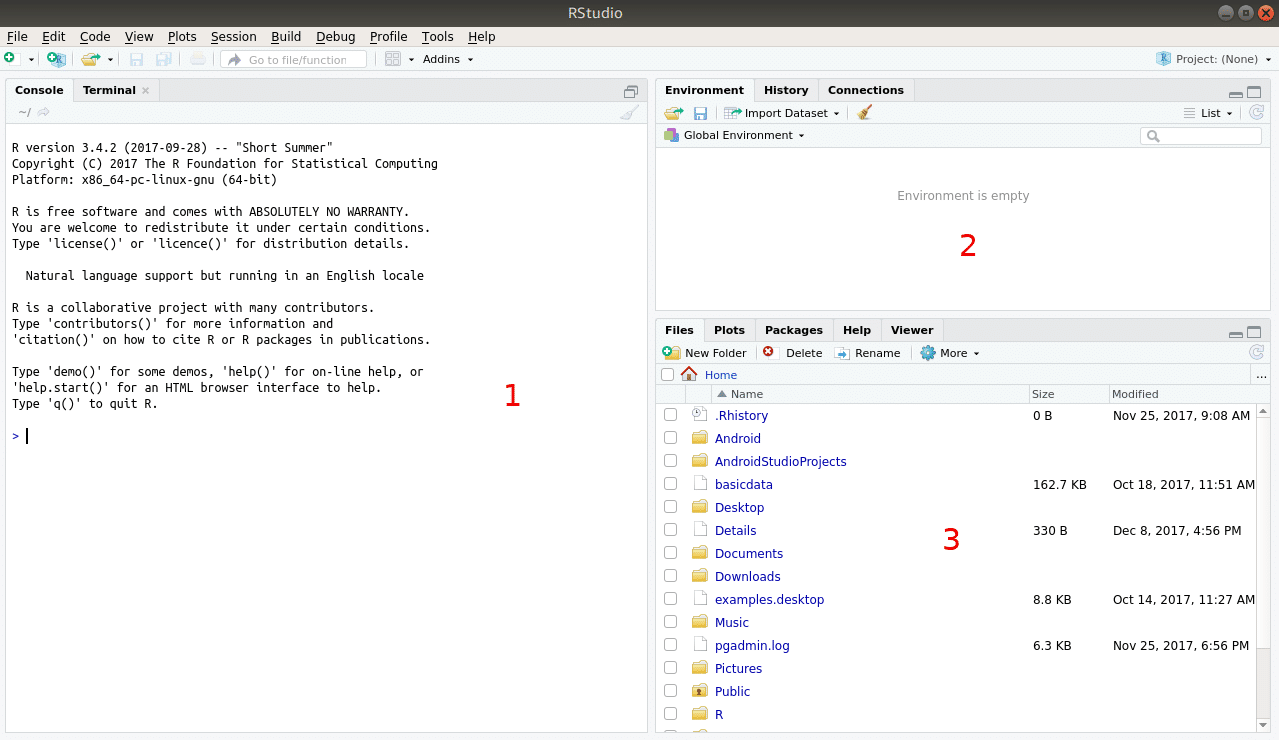
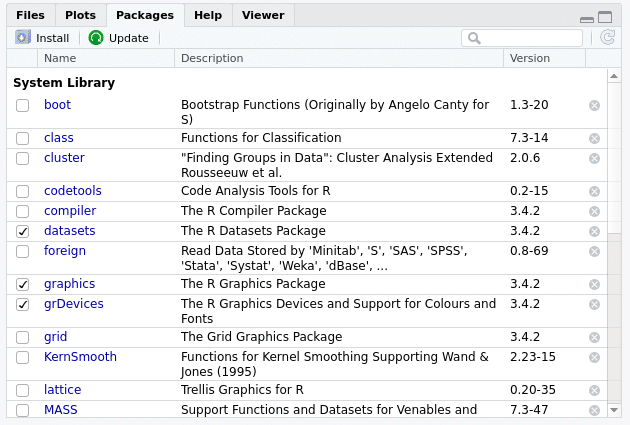
Clicking on the Packages tab in Section 3 will list all the packages available in R Studio, as shown in Figure 6.
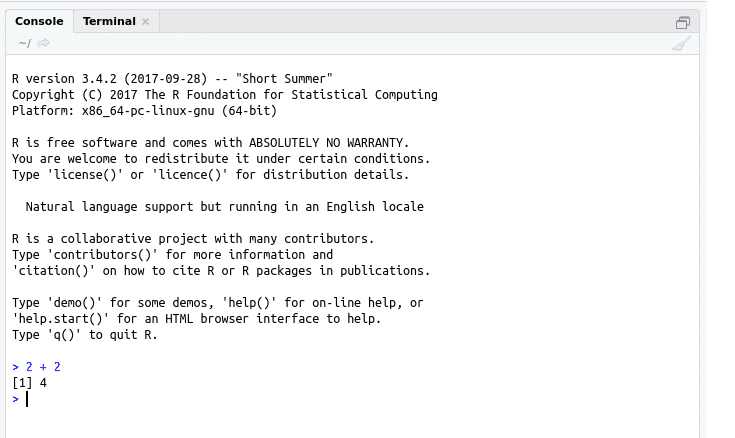
Using R is very straightforward. On the console area, type ‘2 + 2’ and you will get ‘4’ as the output. Refer to Figure 7.
The R console supports all the basic math operations; so one can think of it as a calculator. You can try to do more calculations on the console.
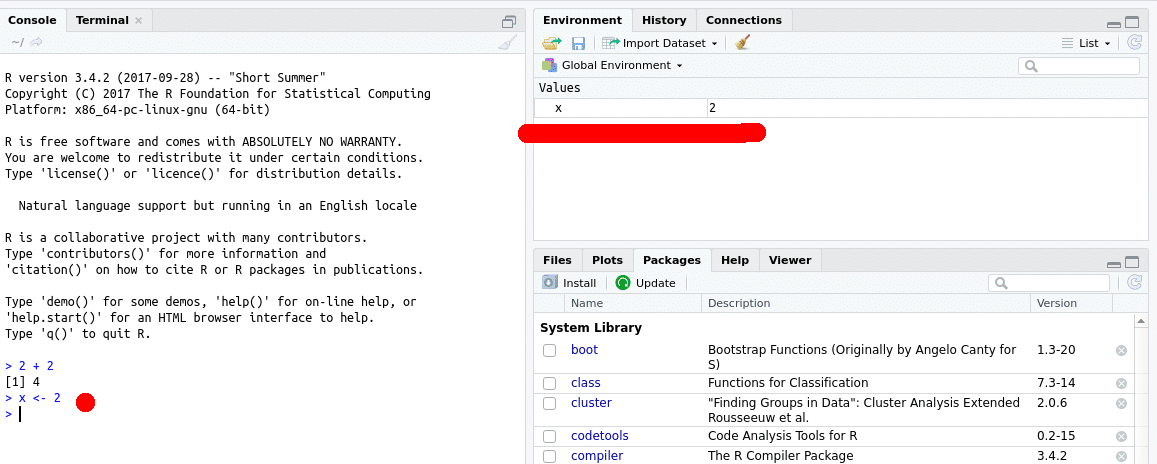
Creating a variable is very straightforward too. To assign ‘2’ to variable ‘x’, use the following different ways:
> x <- 2

OR

> x = 2

OR

> assign(“x”,2)

OR

> x <- y <- 2
One can see that there is no concept of data type declaration. The data type is assumed according to the value assigned to the variable.


As we assign the value, we can also see the Environment panel display the variable and value, as shown in Figure 8.
A rm command is used to remove the variable.
R supports basic data types to find the type of data in variable use class functions, as shown below:
> x <- 2

> class(x)

[1] “numeric”
The four major data types in R are numeric, character, date and logical. The following code shows how to use various data types:
> x<-”data”

> class(x)

[1] “character”

> nchar(x)

[1] 4

> d<-as.Date(“2017-12-01”)

> d

[1] “2017-12-01”

> class(d)

[1] “Date”

> b<-TRUE

> class(b)

[1] “logical”
Apart from basic data types, R supports data structures or objects like vectors, lists, arrays, matrices and data frames. These are the key objects or data structures in R.
A vector stores data of the same type. It can be thought of as a standard array in most of the programming languages. A ‘c’ function is used to create a vector (‘c’ stands for ‘combine’).
The following code snippet shows the creation of a vector:
> v <- c(10,20,30,40)

> v

[1] 10 20 30 40
The most interesting thing about a vector is that any operation applied on it will be applied to individual elements of it. For example, ‘v + 10’ will increase the value of each element of a vector by 10.
> v + 10

[1] 20 30 40 50
This concept is difficult to digest for some, but it’s a very powerful concept in R. Vector has no dimensions; it is simply a vector and is not to be confused with vectors in mathematics which have dimensions. Vector can also be created by using the ‘:’ sign with start and end values; for example, to create a vector with values 1 to 10, use 1:10.
> a <- 1:10

> a

[1] 1 2 3 4 5 6 7 8 9 10
It is also possible to do some basic operations on vectors, but do remember that any operation applied on a vector is applied on individual elements of it. For example, if the addition operation is applied on two vectors, the individual elements of the vectors will be added:
> a<-1:5

> b<-21:25

> a+b

[1] 22 24 26 28 30

> a-b

[1] -20 -20 -20 -20 -20

> a*b

[1] 21 44 69 96 125
A list is like a vector, but can store arbitrary or any type of data. To create a list, the ‘list’ function is used, as follows:
> l <- list(1,2,3,”ABC”)

> l

[[1]]

[1] 1

[[2]]

[1] 2

[[3]]

[1] 3

[[4]]

[1] “ABC”
A list can be used to hold different types of objects. It can be used to store a vector, list, data frame or anything else.
An array is nothing but a multi-dimensional vector that can store data in rows and columns. An array function is used to create an array.
> arr <- array(21:24, dim=c(2,2))

> arr

[,1] [,2]

[1,] 21 23

[2,] 22 24
A data frame and matrix are used to hold tabular data. It can be thought of as an Excel sheet with rows and columns. The only difference between a data frame and matrix is that in the latter, every element should be of the same type. The following code shows how to create the data frame:
> x<-1:5

> y<-(“ABC”, “DEF”, “GHI”, “JKL”, “MNO”)

> z<-c(25,65,33,77,11)

> d <- data.frame(SrNo=x, Name=y, Percentage=z)

> d

SrNo       Name       Percentage

  1        1 ABC         25

  2        2 DEF         65

  3        3 GHI         33

  4        4 JKL         77

  5        5 MNO         11
So a data frame is nothing but a vector combined in the column format.
This article gives a basic idea of how data is handled by R. I leave the rest for you to explore.


