Big Data today influences our lives in the most unexpected ways, and organisations are using it extensively to gain that competitive edge in the market. So let’s get acquainted with the open source tools that help us to handle Big Data.
Gone are the days when banks used to store customer information (such as names, photographs and specimen signatures) in individual postcard-like data sheets. That was an era where thick registers were used in different government offices like post offices, property tax collection centres, etc, to store customers’ details or maintain the daily attendance records of employees. If an employee had to update any of the registered customer’s details, the task could take up the whole day. Hours were wasted searching for that particular customer’s details and then creating a new record to replace the old one. The customers, too, had to wait for hours for such minor tasks to be completed. Apart from the tediousness of searching for data from piles of ledgers, such paper files could be lost at any time due to disasters like floods or fire, apart from the degradation of the very paper on which the data was recorded.
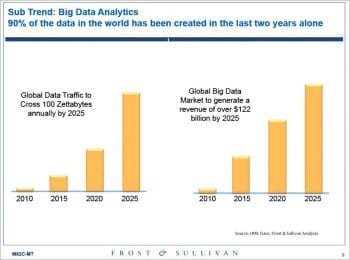
Today, on our journey towards a digital India, all government offices are switching to digitisation instead of manual record keeping. As we proceed along this path, we see a tremendous increase in the size of data. There are around 230 billion tweets posted on Twitter per day, 2.7 billion Likes and comments added to Facebook daily, and around 60 hours of video uploaded to YouTube every minute. All this leads to about 2.5 exabytes of data being generated on a daily basis by different online applications, transactional data sources, IoT devices, etc. The term that encapsulates such immense volumes of information is Big Data. Existing hardware and software systems are unable to handle such volumes of different types of data being created at such enormous speed. The data has also become too complex and dynamic to be stored, processed, analysed and managed with traditional data tools. So Big Data is now analysed by computer systems to reveal specific trends, patterns and associations, especially those relating to human behaviour and interactions. We are making our machines smart enough to ‘think and decide’ on what action needs to be performed and when by using Big Data techniques like predictive analytics, user-behaviour analytics, etc.
How large companies use Big Data
1. The techniques listed later in this article help to extract useful insights from large data sets, which are leveraged further for different surveys, statistics and case studies.
2. Flipkart, Amazon and other such online e-commerce sites make use of these techniques to study the behaviour of their customers and help them get what they want.
3. Facebook supposedly knows more about each one of us than our own therapists do and it’s possible only because of the different Big Data techniques it implements. It continuously keeps track of different user actions, photo uploads, comments, shares, etc, using these techniques.
4. MNCs like Walmart make use of Big Data to improve their ‘employee intelligence quotient’ and ‘customer emotional intelligence quotient’.
5. Family restaurants like Dominos, McDonald’s and KFC use predictive and user-behaviour analytics to increase the efficiency of their marketing and continuously improve the customer experience.
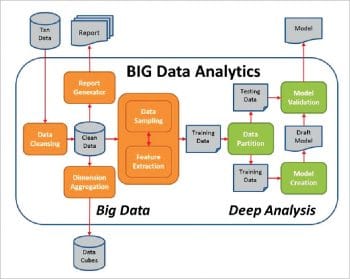
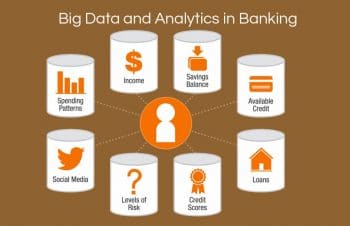
What must be considered while analysing Big Data?
Let’s have a look at the different factors that an analyst must consider while working with Big Data.
1. Ingestion: This process is about moving data (especially unstructured data) from where it originated, into a system where it can be stored and analysed. Data ingestion can be continuous or asynchronous, in real-time or batched, or even both.
2. Harmonisation: This deals with the improvement of data quality and its use with the help of different machine learning capabilities. It also interprets the characteristics of the data and the different actions taken on it, subsequently using that analysis to improve data quality.
3. Analysis: This deals with the analysis of the data sets in order to understand the behaviour of data and identify specific patterns or trends, so that different actions can be performed on that data set.
4. Visualisation: Data visualisation is the process of presenting the data in a pictorial or graphical format. This helps decision makers to grasp difficult concepts or identify new patterns in the data set.
5. Democratisation: This is the ability for specific information in a digital format to be accessible to the end user. This is used to enable non-specialists to gather and analyse larger data sets without requiring outside help.
Popular techniques for analysing Big Data
Let’s have a look at some of the popular techniques that are being used for analysing large data sets. All of them generate useful insights that can be used further for diverse applications.
A/B testing: This is a method of comparing the two versions of an application to determine which one performs better. It is also called split testing or bucket testing. It refers to a specific type of randomised experiment, under which a group of users is presented with two variations of some product (an email, advertisement or Web page)—Variation A and Variation B. The users exposed to Variation A are referred to as the control group, because their performance is considered as the baseline against which any improvement in the performance observed from presenting the Variation B is measured. Variation A sometimes acts as the original version of the product being tested against what existed before the test. The users exposed to Variation B are called the treatment group.
A/B testing is used to optimise a conversion rate by measuring the performance of the treatment against that of the control group using certain mathematical calculations. This technique takes the guesswork out of website optimisation and enables various data-informed decisions that shift business conversations from what ‘we think’ to what ‘we know’. By measuring the impact that different changes have on our metrics, we can make sure that every change produces positive results.
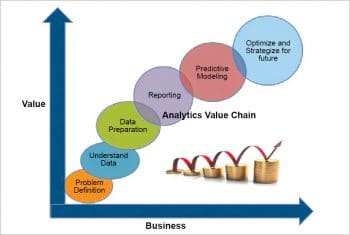
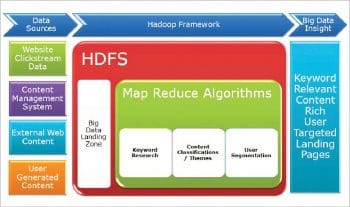
Association rule learning: Association rule learning is rule-based machine learning used to discover interesting relationships between variables in large databases. It uses a set of techniques for discovering the interesting relationships, also called ‘association rules’, among different variables present in large databases. All these techniques use a variety of algorithms to generate and test different possible rules. One of its common applications is market basket analysis. This enables a retailer to determine the products frequently bought together and hence use that information for marketing (for example, the discovery that many supermarket shoppers who buy diapers also tend to buy beer). Association rules are being used today in Web usage mining, continuous production, intrusion detection and bioinformatics. These rules do not consider the order of different items either within the same transaction or across different transactions.
Natural language processing: This is a field of computational linguistics and artificial intelligence concerned with the interactions between computers and human languages. It is used to program computers to process large natural language corpora. The major challenges involved in natural language processing (NLP) are natural language generation (frequently from machine-readable logical forms), natural language understanding, connecting the language and machine perception, or some combination thereof. NLP research has relied mostly on machine learning. Initially, many language-processing tasks involved direct hand coding of the rules, which is not suited to natural language variation. Machine-learning pattern calls are now being used instead of statistical inferences to automatically learn different rules through the analysis of large different real-life examples. Many different classes of machine learning algorithms have been applied to NLP tasks. These algorithms take large sets of ‘features’ as input. These features are generated from the input data.
Research has focused more on the statistical models, which make soft and probabilistic decisions based on attaching the real-value weights to each input feature. The edge that such models have is that they can express the relative certainty of more than one different possible answer rather than only one, hence producing more reliable results as compared to when such a model is included as one of the components of a larger system.
Open source tools to handle Big Data
We have already seen how Big Data is processed and analysed using different techniques. Now, let’s go over some of the open source tools that can be used to handle Big Data in order to get some significant value from it.
Apache Hadoop
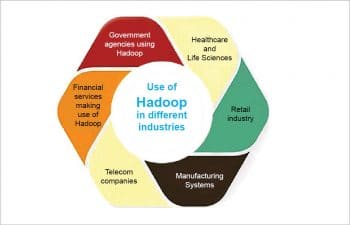
Apache Hadoop is an open source software framework used for the distributed storage and processing of large data sets using the MapReduce programming model. It consists of computer clusters built using commodity hardware. All the different modules in Hadoop are actually designed with the assumption that different hardware failures are commonly observed occurrences and they should be automatically handled by the framework.
Features:
- The Hadoop framework is mostly written in Java, with some of its native code in C. Its command line utilities are written as shell scripts.
- Apache Hadoop consists of a large storage part, known as the Hadoop Distributed File System.
- It uses the MapReduce programming model to process large data sets.
- Hadoop splits different files into large blocks and then distributes them across various nodes in a cluster.
- It transfers packaged code into different nodes to process the data in parallel.
- Apache Hadoop makes use of the data locality approach, where nodes manipulate all the data they have access to. This allows the large dataset to be processed faster and even more efficiently.
- The base Apache Hadoop framework is composed of different modules: Hadoop Common, HDFS, Hadoop YARN and Hadoop MapReduce.
Cassandra
This is an open source distributed NoSQL database management system. It’s designed to handle large amounts of data across many different commodity servers, hence providing high availability with no single point of failure. It offers strong support for clusters that span various data centres, with its asynchronous master less replication allowing low latency operations for all clients.
Features:
- It supports replication and multiple data centre replication.
- It has immense scalability.
- It is fault-tolerant.
- It is decentralised.
- It has tunable consistency.
- It provides MapReduce support.
- It supports Cassandra Query Language (CQL) as an alternative to the Structured Query Language (SQL).
KNIME
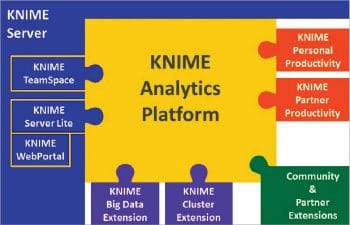
Also called Konstanz Information Miner, this is an open source data analytics, integration and reporting platform. It integrates different components for data mining and machine learning through its modular data pipelining concept. A graphical user interface allows the assembly of nodes for data pre-processing (which includes extraction, transformation and loading), data modelling, visualisation and data analysis. Since 2006, it has been widely used in pharmaceutical research, but now it is also used in areas like customer data analysis in CRM, financial data analysis and business intelligence.
Features:
- KNIME is written using Java and is based on Eclipse. It makes use of its extension capability to add plugins, hence providing additional functionality.
- The core version of KNIME includes modules for data integration, data transformation as well as the commonly used methods for data visualisation and analysis.
- It allows users to create data flows and selectively execute some or all of them.
- It allows us to inspect the models, results and interactive views of the flow.
- KNIME workflows can also be used as data sets to create report templates, which can be exported to different document formats like doc, PPT, etc.
- KNIME’s core architecture allows the processing of large data volumes which are only limited by the available hard disk space.
- Additional plugins allow the integration of different methods for image mining, text mining as well as time series analysis.
Rapid Miner
This is basically a data science software platform. It is used for business and commercial applications as well as for education, research, rapid prototyping, training and application development. It supports all the steps of the machine learning process including data preparation, model validation, results visualisation and optimisation. It has been developed on an open core model. It provides a graphical user interface to design and execute different analytical workflows. All such workflows are called ‘processes’ and they consist of multiple ‘operators’. Each of these operators perform a single task within their respective processes, and the output of each operator forms the input for the next one. Also, the engine can be called from other programs or can be used as an API.
Features:
- Uses a client or server model with the server offered either on premise, or in private or public cloud infrastructures.
- Ninety-nine per cent of this advanced analytical solution is provided through different template-based frameworks that accelerate delivery and reduce errors by almost eliminating the need to write code.
- Provides various machine learning and data mining procedures including data loading and transformation, predictive analytics and statistical modelling, data pre-processing and visualisation, evaluation and deployment, etc.
- Is written using the Java programming language.
- Provides different learning schemes, algorithms and models, which can be extended using Python and R scripts.
- Its functionality can be easily extended with additional plugins, which are made available via its ‘Marketplace’, which provides a platform for developers to create data analysis algorithms and then publish them for the community.
Best practices for handling Big Data
1. Always try to bring the huge data set down to its unique set by reducing the amount of data to be managed.
2. It’s a good practice to leverage the power of virtualisation technology. All unique data sets must be virtualised so that multiple applications can reuse the same data footprint. This will also help the smaller data footprint to be stored on any vendor-independent storage device.
3. Structure different Big Data environments around analytics, not standard reporting or ad hoc querying.
4. Do not try to build a legacy Big Data environment, since this is transforming too rapidly at this point in time.
5. Try to implement flexible Big Data approaches. Assume you will reprogram and rehost all your Big Data applications within two years. Choose such approaches that can be reprogrammed or rehosted.
6. Use a metadata-driven codeless development environment as it can increase overall productivity.
7. Understand different Big Data technology options and try to go for the best one.
8. It’s always good to continually test your Big Data assumptions in order to keep a check on the correct output.












Excellent.
Big data is data sets that are so voluminous and complex that traditional data processing application software are inadequate to deal with them. Big data challenges include capturing data, data storage, data analysis, search, sharing, transfer, visualization, querying, updating and information privacy. There are five dimensions to big data known as Volume, Variety, Velocity and the recently added Veracity and Value.
Lately, the term “big data” tends to refer to the use of predictive analytics, user behavior analytics, or certain other advanced data analytics methods that extract value from data, and seldom to a particular size of data set. “There is little doubt that the quantities of data now available are indeed large, but that’s not the most relevant characteristic of this new data ecosystem.” Analysis of data sets can find new correlations to “spot business trends, prevent diseases, combat crime and so on.” Scientists, business executives, practitioners of medicine, advertising and governments alike regularly meet difficulties with large data-sets in areas including Internet search, fintech, urban informatics, and business informatics. Scientists encounter limitations in e-Science work, includingmeteorology, genomics, connectomics, complex physics simulations, biology and environmental research.
Data sets grow rapidly – in part because they are increasingly gathered by cheap and numerous information-sensing Internet of things devices such as mobile devices, aerial (remote sensing), software logs, cameras, microphones, radio-frequency identification (RFID) readers and wireless sensor networks. The world’s technological per-capita capacity to store information has roughly doubled every 40 months since the 1980s; as of 2012, every day 2.5 exabytes (2.5×10¹⁸) of data are generated. By 2025, IDC predicts there will be 163 zettabytes of data. One question for large enterprises is determining who should own big-data initiatives that affect the entire organization.
Relational database management systems and desktop statistics- and visualization-packages often have difficulty handling big data. The work may require “massively parallel software running on tens, hundreds, or even thousands of servers”. What counts as “big data” varies depending on the capabilities of the users and their tools, and expanding capabilities make big data a moving target. “For some organizations, facing hundreds of gigabytes of data for the first time may trigger a need to reconsider data management options. For others, it may take tens or hundreds of terabytes before data size becomes a significant consideration.”(Wikipedia).
Dr.A.Jagadeesh Nellore(AP),India
Very informative post, even map reduce is quite efficient to handle the big data, especially for the ecommerce companies to group the customer behaviors. I’m gonna try Cassandra, it seems quite useful.