Wireshark is the world’s foremost network protocol analyser. It lets users see what is happening in the network at a microscopic level. It is used for network troubleshooting, analysis, software and communications protocol development and education.
Wireshark is a valuable tool for network administrators and enthusiasts, which is used to capture the packets in real-time on any operating system. This enables admins to understand the functions of various protocols, to troubleshoot live network problems, and monitor the network for intrusion detection. It can also be used for a software defined network (SDN).Wireshark is application software that helps you to visualise the traffic on the network interface controller. Data can be read from the captured packets using a graphical user interface (GUI). It can capture packets in promiscuous mode (all the packets in a LAN), and dissect more than a thousand protocols. Wireshark is free and open source under the terms of the GNU (General Public License). It is cross-platform and helps us understand the structure of various network protocols. It uses the Pcap (packet capture library) to capture packets from different network technologies; raw USB traffic and compatible encoded VoIP calls can also be captured and played.
Wireless tools are used to capture wireless network traffic. Wireshark captures packets from network simulation tools like ns, OPNET, NeTSim, etc. Users can customise this packet sniffer based on their needs. It gives statistical results of the packets captured, as well as graphs such as the I/O graph, round-trip time graph and flow graph. It gives us expert information to understand the state of the packet using a particular protocol category like chat, note, warning, error, etc. This software is widely used in industries and academic institutions.Wireshark loads the Pcap driver, which uses NDIS (Network Driver Interface Specification) to read packets directly from a network interface card. In this article, we will figure out how to install and use Wireshark for the Windows operating system.The latest version of Wireshark can be downloaded from its official website. There are also options available for other operating systems.
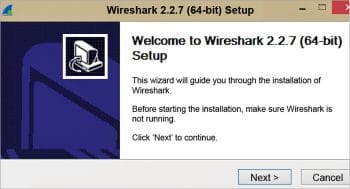
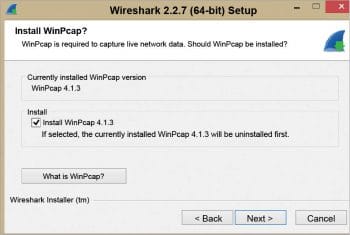
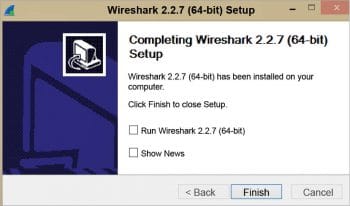
How to install Wireshark
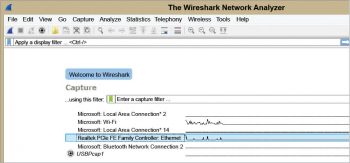
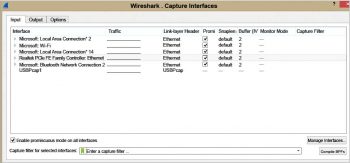
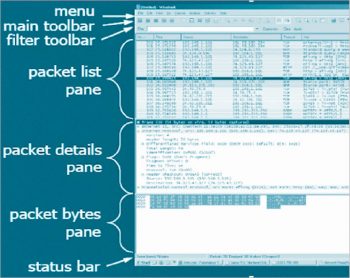
The downloaded executable file should be run to install Wireshark.You can capture the packets with the default options by selecting the appropriate interface. Here, we have selected the Local Area Connection interface (highlighted). Click the shark icon in the top left corner to start capturing. If you want to modify the default options, you can do so before you choose the interface. There are options available to perform various name resolutions (Figure 5).Wireshark consists of three windows – the packet list pane, the packet details pane and the packet bytes pane, as shown in Figure 6. The packet list pane displays the live frames captured in columns. The serial number of the frame captured, the time, the IPv4 address of the source machine, the destination machine, the protocol involved, the length of the frame and the information column that describes the frame captured are given in the consecutive columns. Users can customise these columns based on their interests.The packet details pane gives all the encapsulation details of the information that flows down from the application layer to the physical layer. The bytes pane displays the contents of the packet selected as hexadecimal, ASCII formats.
Experiment 1
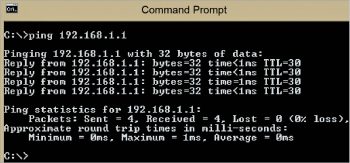
To understand the use of Wireshark, let us conduct a simple experiment. The aim is to check the connectivity from a desktop in a local area network, to its gateway. For the purposes of the experiment, let’s assume that the gateway IPv4 address is 192.168.108.1. , the source machine IP address is 192.168.108.83., and we use the command window of the source machine. The command ping is issued as follows:
1 | C:\>ping 192.168.108.1 <Enter>. |
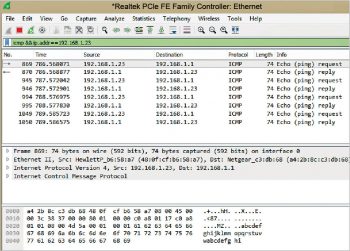
Ping is a command line software utility used to check the connectivity from a source to a destination in a network. By default, ping sends four packets from the source to the destination. It uses the Internet Control Message Protocol (ICMP) to echo request packets and reply. The ICMP gives the results for the round-trip time and statistical information about the activity.The ping command is used to echo the packets from the source to the destination, and the destination is 192.168.108.1. Four packets of size 32 bytes are sent serially to the destination. Wireshark sniffs these activities. To filter the ping results, the command syntax ICMP is applied in the filter available in Wireshark. It filters and displays the frames related to ICMP. Filters can be applied on protocols, fields, values, etc. To be more specific, the IPv4 address of the source machine is added to the filter.
1 | Filter : icmp && ip.addr==192.168.108.78 |
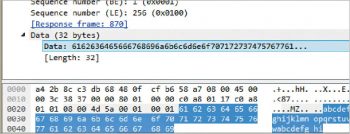
The result is shown in Figure 8.To validate the Wireshark capture, one of the frames is selected in the packet list pane (highlighted). The details with respect to the access layer, network layer, transport layer and application layer protocol data unit (PDU) encapsulation can be analysed.Figure 9 shows the components of the ICMP protocol—32 bytes of data are represented in hexadecimal, ASCII formats.
Experiment 2
To further understand the use of Wireshark, let us carry out another experiment which will help us to see the components of HTTP and the TCP protocols. Stop packet capture using the icon on the left hand top corner under the Tools menu. Restart the packet capture using the same icon, and click on ‘Continue without saving’.Open any browser and start browsing multiple Web pages to capture a greater number of HTTP packets. Stop the capture, apply the HTTP filter and the IP address of the source machine.
1 | Filter: http && ip.addr==192.168.108.83 |
The packet list pane shows only the HTTP traffic related to the IP address applied on the filter. The details pane displays the components of HTTP traffic. Web browsing is supported by the HTTP and TCP protocols. Clear the filter using the icon at the end of the filter. Then apply the TCP filter and the IP address of the source machine.
1 | Filter: tcp && ip.addr==192.168.108.83 |
I do hope these two experiments have helped you to understand this excellent network monitoring tool a little better.


