
Computer attacks are a constant concern for admins and users of computers. These are attacks that are stealthy enough not to leave any traces on the hard disk of the computer. To detect such attacks, we need to make a forensic analysis of the memory dump of the computer. This analysis is termed memory forensics. Volatility is the open source framework that could help us with memory forensics.
According to Wikipedia, “Memory analysis is the science of using a memory image to get information about running programs, the operating system, and the overall state of a computer.” Volatile memory contains valuable information about the runtime state of the system (the network, file system and registry). In this article, we are going to investigate the digital artifacts of volatile memory using Volatility.
Introducing Volatility
Volatility is an open source framework used for memory forensics and digital investigations. The framework inspects and extracts the memory artifacts of both 32-bit and 64-bit systems. The framework has support for all flavours of Linux, Windows, MacOS and Android. It can analyse raw memory dumps, crash dumps, virtual machine snapshots, VMware dumps (.vmem), Microsoft crash dumps, hibernation files, virtual box dumps, and many others. The framework is intended to investigate the system’s state independently and consists of over 35 plugins for analysing. Volatility is available as pre-installed binaries in several Linux flavours such as REMnux, Kali Linux, etc. It is freely available in Git (https://github.com/volatilityfoundation/volatility).

Memory format support
Volatility supports a variety of sample file formats and has the ability to convert between these formats. These are:
- Raw/padded physical memory
- Firewire (IEEE 1394)
- Expert Witness (EWF)
- 32-bit and 64-bit Windows Crash Dump
- 32-bit and 64-bit Windows Hibernation File
- 32-bit and 64-bit Mach-O files
- Virtualbox ELF64 Core Dumps
- VMware Saved State (.vmss) and Snapshot (.vmsn)
- HPAK format (FastDump/FDpro)
- QEMU memory dumps
- LiME (Linux Memory Extractor) format
- Mac-0 file format
Operating system support
- Support for all 32-bit and 64-bit Windows systems
- Support for 32-bit and 64-bit Linux kernels ≤ 4.2
Installation
Python 2.7 is a pre-requisite for installing Volatility. To install on a Linux system, you can download and extract the archive from https://github.com/volatilityfoundation/volatility.
Then run the following command:
sudo python setup.py install
Or, run the following command:
apt-get install volatility
Installation of Volatility in Windows is manual and needs additional packages. These are listed below.
Distorm 3: A powerful disassembler library for x86/AMD64
Yara: A malware identification and classification tool
Pycrypto: The Python cryptography toolkit
Pillow: The Python imaging library
Openpyxl: The Python library to read/write Excel
Ujson: An ultra-fast JSON parsing library
Pytz: This is for time zone conversion
Installation using an executable
A standalone executable can be downloaded from http://www.volatilityfoundation.org/#!24/c12wa (available in both the standalone version and the Python Win32 module version).

Memory inspection
In order to analyse the memory dumps, the profile should be defined prior to execution. You can start trying the software using the memory sample available for testing purposes at https://github.com/volatilityfoundation/volatility/wiki/Memory-Samples.
The syntax is:
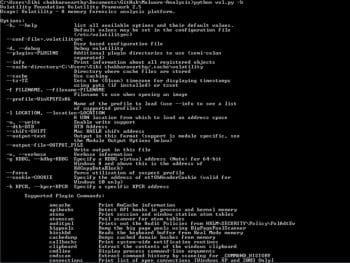
python vol.py –h
The above executed command shows you the available options in the Volatility framework.
In general, everything in the OS traverses RAM. Tracing the RAM fingerprints can be helpful to detect some advanced malware. In this article, we explore some plugins, which are available in the Volatility framework. Let me take a memory sample of the malware ‘stuxnet’ downloaded from the above link. Unzip the Stuxnet.zip file and extract Stuxnet.vmem, which is a virtual memory file. Given below are a few fingerprints that have been extracted from the sample. Volatility helps us to identify the OS’ profile information, which gives the meta information about the memory file. Volatility can inspect the live memory image of any operating system. The framework can give the status of an active process, a hidden process, unlinked processes, Dll loaded in runtime, socket information, external connection information, etc. Some of the plugins were tested and the results were given.
1. Imageinfo: This identifies the profile image. The syntax is:
python vol.py imageinfo –f Stuxnet.vmem
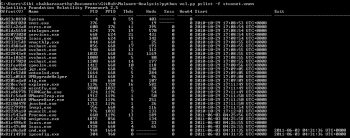
2. Pslist: This lists the running process. The syntax is:
python vol.py pslist –f Stuxnet.vmem
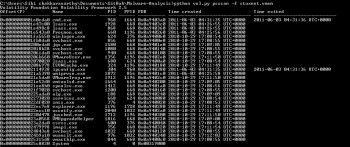
3. Psscan: This plugin scans the hidden/inactive/unlinked processes and is used for malware analysis. The syntax is:
python vol.py psscan –f Stuxnet.vmem
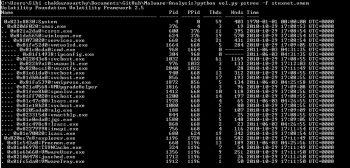
4. Pstree: This plugin displays the running process in tree form. The syntax is:
python vol.py pstree –f Stuxnet.vmem
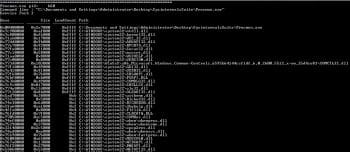
5. DLL list: This displays the DLLs used by all the processes. Here, Figure 6 denotes the screenshot of the process ID: 660 and its associated DLLs. The syntax is:
python vol.py dlllist –f Stuxnet.vmem
6. Sockets: This plugin is used to find out the listening socket connections during the time of the memory dump. The syntax is:
python vol.py sockets –f Stuxnet.vmem
7. Timeliner: This creates a timeline from various artefacts in memory. The syntax is:
python vol.py timeliner –f Stuxnet.vmem
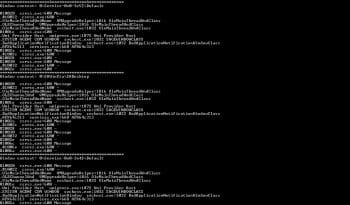
8. Wintree: This prints the Z-Order Desktop Windows tree. The syntax is:
python vol.py wintree –f Stuxnet.vmem
Present day malware are stealthier and remain hidden during dynamic behaviour analysis. In order to detect such types of malware and their behaviour, run time memory inspection can be carried out. Malware, including rootkit, traverses the RAM; hence the Volatility framework helps us to inspect the live memory of any operating system. This can help us to possibly detect some advanced malware, which is very persistent in its behaviour.


