
Enterprise class IT system monitoring of servers, networks and applications is possible with the FOSS tool Nagios. Problems can be identified and remedied long before they become critical and lead to system failures and downtime. Nagios is very versatile as it is platform-independent.
Nagios is a highly powerful open source monitoring tool which helps IT enabled sectors to provide an early diagnosis of as well as address critical failures in the monitored network. Unknown server breakdowns or any network outages can be reported well in advance before critical business gets affected. The major aspects of the tool are scalability and flexibility. It also provides online reporting of network statistics and by making it the central management system, administrators can detect any anomalies in the network. Early detection and mitigation of such malicious threats can improve the quality of service without affecting the clients.
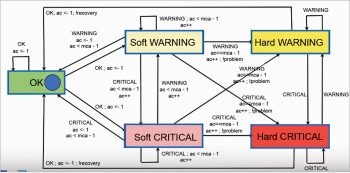
Nagios is a widely used open source network monitoring software deployed across networks. It keeps track of the hosts and their respective services. It alerts administrators when the system senses any intrusions and malicious activities. It also completely monitors the IT enabled network, providing online reporting of services, running applications and keeping an eye on whether processes are functioning properly. Once a failure is encountered, the alerts are reported, enabling admins to take proper remedial measures before the entire network shuts down or an outage is experienced by the end users. The infected machines can be isolated from the network so that the security of the network is assured and quality of service is achieved. The algorithm and the functionality of Nagios XI is shown with the help of a service state diagram in Figure 1.
Nagios can be used for cluster management, monitoring Web services and as the central management system, depending on the deployment model. When an agent based system is used for monitoring purposes, it consumes host resources such as CPU and memory. The monitoring can be carried out at the host and network level to report system statistics. The intelligent platform management interface (IPMI) stack is used for hardware monitoring. Host monitoring can be carried out using Nagios, Ganglia or other related software. HPC cluster monitoring integrates the IPMI stack with Nagios. The unified framework summarises the hardware monitoring of the server to the Nagios Web interface.
The IPMI sub-system functions autonomously, irrespective of the OS, and permits administrators to monitor the system remotely without the presence of the OS or the management application. The system can be monitored continuously and it abstracts the data from local area networks when the power source is connected. The IPMI prescribes only the structure and format of the interfaces as a standard, while the deployment varies.
Monitoring checks
The monitoring checks can be categorised into local and remote. Local checks include the following aspects:
- Monitoring the Windows desktop
- Monitoring Windows server
Remote checks include the following aspects:
- Monitoring website URLs
- Google Map integration with NagiosXI
Monitoring the Windows desktop
On a Windows desktop, NagiosXI monitors the following:
- Memory usage
- CPU load
- Disk usage
- Service states
- Running processes
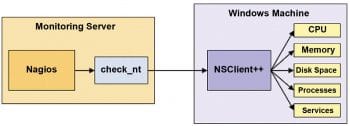
Monitoring private services or attributes of a Windows machine requires the installation of an agent. The agent acts as a proxy between the NagiosXI plugins, which do the monitoring of the actual service or attribute of the Windows machine. We have used NSClient++ as the add-on on the Windows machine and are using the check_nt plugin to communicate with the NSClient++ add-on.
How NSClient++ communicates with NagiosXI is shown in Figure 2.
How to configure NSClient++ in Windows: After downloading the NSClient++ 4.0.2, we have to install it and, during installation, specify the IP address of our NagiosXI machine as well as the NSClient password.
Configuring NSClient in NagiosXI: After installing NSClient++ in Windows, we have to make some changes in the NagiosXI configuration wizard and select the Windows desktop option, before setting the IP address of the Windows desktop in NagiosXI.
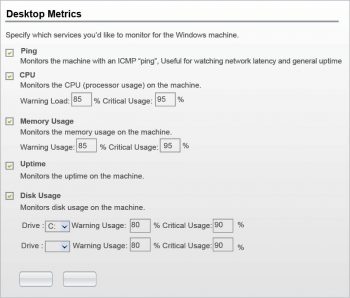
Settings for the desktop metrics: We can set our own parameters for monitoring the desktop. For CPU, memory usage and disk usage, we have to set our own threshold value, below which the ‘soft state’ will be converted into the ‘hard critical’ and ‘hard warning’ state. The desktop metrics settings are shown in Figure 3.
Desktop monitoring settings: We can determine the maximum number of checks for the desktop. The NagiosXI will keep on checking till the count reaches the maximum count value, after which NagioXI will notify the admin about the error with the help of alert messages and e-mails.
Settings for desktop notifications: Once an error has been detected, the admin should be informed on time before the end user gets to know. Various methods are used for notifying the admin. We can create our own method of notification using e-mails, SMS alerts, etc.
After configuring all the initial settings, we can show the status of CPU usage, disk drives, etc. The checks display the states of various monitored parameters. They also display the maximum checks for each device.
Monitoring Windows Server
Now, let’s monitor the Windows Server, just as we have monitored the Windows desktop.
The steps to be followed for Windows Server are listed below:
1. First, the agent NSClient++ must be installed in our Windows machine.
2. Inside NagiosXI, we have to configure the Windows server option and then assign the IP address 192.168.5.67 (for example) to the Windows server.
3.
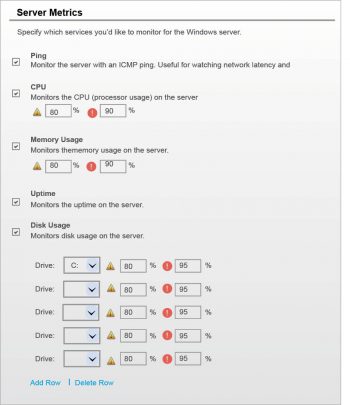
Settings for the server metrics: Just as we did for the Windows desktop, we can set our own parameters for monitoring the servers. For CPU, memory usage, disk usage, etc, we can set our own threshold value, below which the ‘soft state’ will be converted into the ‘hard critical’ and ‘hard warning’ state. The server metrics is shown in Figure 4.
Server services: We can also monitor any services, processes as well as the performance counter of our services, if we want. And the results of this monitoring will be displayed in our dashboard. The services added are shown in Figure 6. We can monitor the SQL server as well as the IIS Web servers.
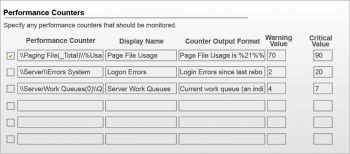
Performance counter: In the performance counter, we are monitoring three major parameters such as page file usage, log on error and server work queue.
We can manually specify the values for critical and warning states. For implementation, we have specified the warning states as: 70 pages for file usage, two for log on errors and a warning of four for the server work queue. This means that if our server processes more than four tasks in a queue then the state will change, and NagiosXI will generate the critical message to the admin to correct the error. The performance counter is shown in Figure 5.
Server monitoring settings: We can also determine the maximum number of checks for the desktop. NagiosXI will keep on checking till the count reaches the maximum count value. Once the value reaches its maximum, NagiosXI will notify the admin about the error with the help of alert messages and e-mails.
Status generation for Windows Server: The status graph of Windows Server contains all the readings of the various parameters that we have initially set. The two services, IIS Web service and SQL service, are both monitored. Both the services are also showing as unknown since the services are not started in the server. Our performance counters are also shown in the graph. The status of the log on errors, page file usage and the server work queue shows ‘OK’. All the server metrics settings, such as CPU usage, Disk D and memory usage, also shows ‘OK’, but Disk C is shown as being in a ‘critical state’ as the attempt count has reached a maximum level.

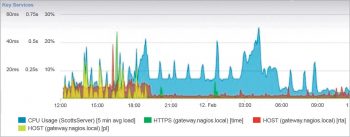
Graph generation: The graph is made based on device monitoring during an entire day, like CPU usage, Nagios host service and Nagios HTTP services. The X-axis shows the time in hours and the Y-axis shows pre-defined states in percentage. The graph is shown in Figure 6.
The blue graph denotes the CPU usage during the entire day, as we can see that according to the time on the X-axis the states are changing during the day. We have pre-defined the levels of critical and warning states as 10 per cent (critical) and 20 per cent (warning state).
The yellow graph shows the packets lost during the entire day. As we can see, the packets are lost only during the first four hours; thus NagiosXI will notify the user every 30 minutes if the critical state is reached.
The red graph shows the round trip average (RPA) time taken by the host to check the plugins performance of the network.
Monitoring website URLs
We can monitor any remote URL by the same process we used to monitor our local checks. We first have to configure the website URL settings in NagiosXI by going to the configuration wizard. Then we can add any URL of the website we want to monitor.
After we have entered the URL, we can change the host name and choose the port number, URL options as well as the URL services. We can setup www.google.com and www.yahoo.com for monitoring.
In Figure 7 we can see the current host status of the Google and Yahoo websites. It shows that there is no error and the attempt count is less than the maximum attempt.
Use the system configuration files and denote the proper IP to achieve the expected target statistics. Sensors like netflow v9 won’t work for public networks because we can’t access the router.
To summarise, when Nagios is properly configured and installed in the network, it can monitor the system effectively for network usage, processes, activities, as well as CPU, memory and disk usage. Choose the appropriate parameter, as all the inherent parameters to report the system statistics are preinstalled. The user can specify the IP address that requires critical monitoring of inbound and outbound traffic.


