JMeter is an Apache project. It is a load testing tool for analysing and measuring the performance of a variety of services, with a focus on Web applications.
Apache JMeter is an open source Apache project (available under the Apache License 2.0) that can be used for load testing. It is a pure Java application to perform load, functional, performance and regression testing. It needs JDK 5 or higher. JMeter can run on Linux, Windows and the Mac OS as a JVM.
Installation of JMeter
1) JMeters latest release can be downloaded from http://JMeter.apache.org/.
2) Click on Download releases in the left pane of the page.
3) Choose the binary file (either Zip or tgz) to download Apache JMeter.
4) To start JMeter, unzip the folder -> go to the bin folder -> click on the JMeter.bat file.
Configuring JMeter
To make JMeter work as a browser, the following proxy settings need to be made:
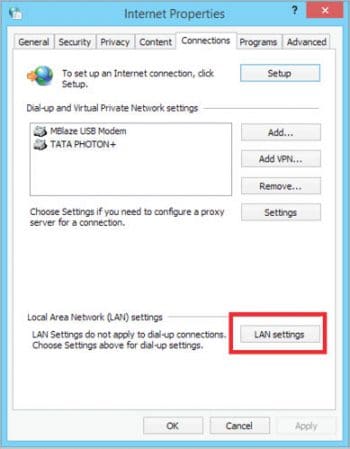
1) Go to Internet settings of the browser and click on LAN settings.
Click on the proxy server checkbox, add localhost in the address field, ensure the port is set as 8080 and click on OK.
Elements of Apache JMeter
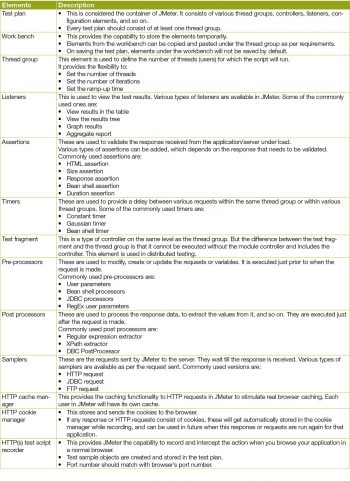
These are listed in Table 1.
The execution order of these elements is important. First, the configuration elements will execute, followed by pre-processors (if applied), then the timers (if applied), with samplers next, followed by post processors (if applied), assertions (if applied) and at the end, listeners.
Samplers and logic controllers are processed in the order in which they are available in the test plan.

Analysis of the performance of the SUL
To analyse the performance of the application, listeners are used. Two types of functions are provided by them:
1) To listen/create the test results on running the script
2) To save, read and view the saved results
Commonly used listeners are listed below.


View results tree: This shows the sample response for every request; along with this, it shows the time and provides the capability to view the response received for every sample. It provides responses in various ways such as:
- Text
- Documents
- HTML
- JSON
- XPATH tester
- CSS/JQUERY tester
But it has one disadvantage. It should not be used during load testing, as it consumes a lot of memory and CPU resources.
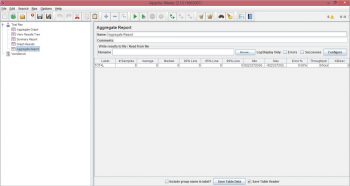
Aggregate report: This displays the results in table form for every sample request. Information provided in the table includes the average time for every sample, median, 90 per cent line, 95 per cent line, error per cent, longest or shortest time for the sample throughput and so on.
Note: If timers are included in the test plan, then that time will also be included in the calculations.


Data can be directly copied and pasted in an Excel sheet as per the requirements. There is also a Save button thats provided at the end to save the complete table.
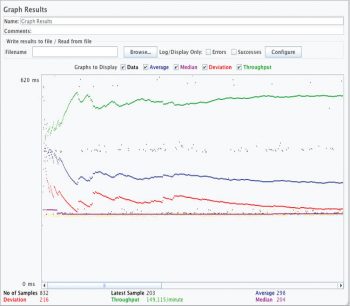
Graph results: This displays results in the form of a graph that plots all sample times. It also provides additional information about things such as median, deviation, average, throughput and so on.


