You can now use the Sysinternals tools to find out which program has a particular file or directory open. The tools available in the Sysinternals suite show details about running process handles and DLLs. The entire suite can be downloaded from https://download.sysinternals.com/files/SysinternalsSuite.zip
Process monitor
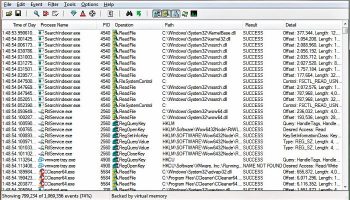
Process monitor is a free utility available to monitor real-time file systems, registry, process/threads and the network. It can be downloaded from https://technet.microsoft.com/en-us/library/bb896645.aspx.
Trace summary tools
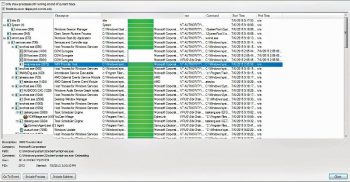
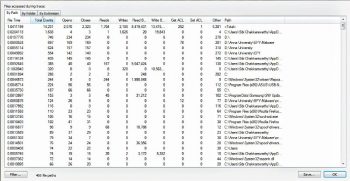
Process monitor includes a number of dialogues that allow you to perform simple data mining on the events collected in a trace.
Process tree displays all of the processes referenced in a hierarchy in the loaded trace, which shows parent-child relationships. Go to Tools > Process Tree or Ctrl+T.
File system
Process monitor displays all the activities of a file system, including local and remote storage. It also detects and monitors new file system devices.
File summary
File summary dialogue lists each unique file system path present in the filtered trace, the amount of time spent performing I/O to the file, the total number of events that referenced the path, and the count of individual operation types.
File summary can be accessed by going to Tools > File summary.
The file summary can be achieved by means of the folder and extension.
Activity summary
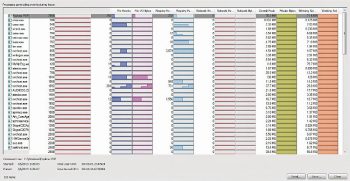
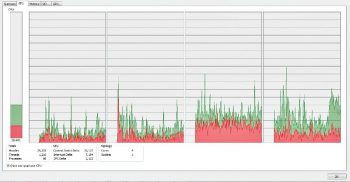
Activity summary lists all the processes seen in the trace, file events, I/O, registry events, network events, including their process ID, image name and command line.
Activity summary can be accessed by going to Tools > Process Activity Summary.
Registry summary
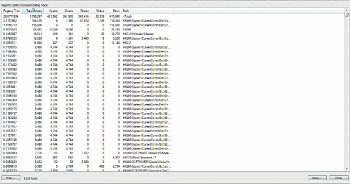
Registry summary lists each unique registry path present in the filtered trace, the amount of time spent performing I/O to the registry path, the total number of events that referenced the path, and the count of individual operation types.
Registry summary can be accessed by going to Tools > Registry Summary.

Stack summary
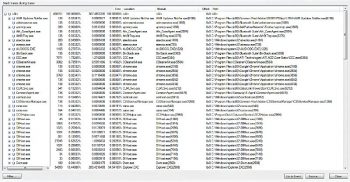
Stack summary is used to visualise individual instances of stack traces for each process. You can access the stack summary by going to Tools > Stack Summary.
Network summary
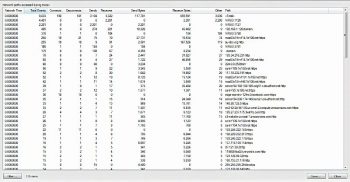
Network summary lists each unique destination IP address present in the trace and a number of different types of events, including sends and receives, to each address.
Go to Tools > Network Summary.
Cross reference summary
This dialogue box shows the paths that are written by one process and read by another one.
Go to Tools > Cross reference summary (paths that are written and read between differing processes).
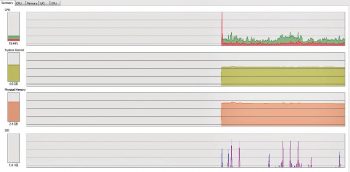
Visualising the process using Process Explorer
Process Explorer helps to visualise the process which, in turn, helps to deeply observe the process and its handles. It can be downloaded from https://technet.microsoft.com/en-in/sysinternals/bb896653.aspx
The tools explained above can help you to learn and analyse the behaviour of a process/thread. The process has to be carried out manually.
References
[1] https://technet.microsoft.com/enin/sysinternals/bb896653.aspx
[2] https://download.sysinternals.com/files/SysinternalsSuite.zip

