System monitoring is a very important activity for any organisation. A system should always be free from malfunctions and should be continuously available to serve its purpose, and for this to happen, efficient system monitoring is a must. One of the most important responsibilities a systems administrator has is to monitor the systems in the network. The systems administrator should be aware of what processes are running on the system, how much memory or CPU resources are being utilised, who is logged in and so on. Good system monitoring can help in maintaining operational continuity and avert any unwanted performance issues. The task of system monitoring can be efficiently done with various sets of tools. GNU/Linux provides various inbuilt utilities for this purpose. One such utility is the top command, which displays a real-time list of processes that are running on the system. It also displays additional information about the system uptime, current CPU and memory usage (or the total number of running processes), and allows you to perform actions such as sorting the list or killing a process. The screen constantly updates itself.
Htop, which is a ncurses based process viewer, offers some very interesting options. It supports mouse operation, uses colour in its output and gives visual indications about the processor, memory and swap usage. Htop also prints full command lines for processes, and allows one to scroll both vertically and horizontally for processes and command lines, respectively. In this article, let us explore what Htop has to offer.
To install Htop on Debian based Linux systems, use the command given below:
$ sudo apt-get install htop |
Htop can be run from the command line by typing the command below:
$ htop |
The output can be broken down into three partsthe header, body and footer.
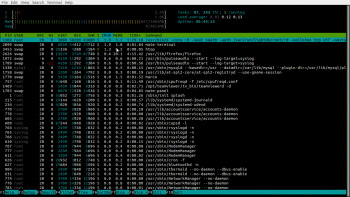
The header displays CPU informationthe numbers 1 and 2 (top-left in Figure 1) represent the number of cores in the system. It also displays memory usage, swap usage and loads the average on the right in the form of text/counters. The progress bars for CPU information are of different colours. The following list will explain what each colour means.
Blue: Low priority processes
Green: User processes
Red: Kernel processes
Yellow: IRQ (interrupt request) time
Magenta: Soft IRQ (interrupt request) time
Grey: IO wait time
Memory and swap bars are also in different colours. Here is a list of what the colours mean in relation to the memory and swap progress bars.
Green: Used memory pages
Blue: Buffer pages
Yellow: Cache pages
The body section lists all the running processes on a system, with information about how much CPU and memory each process is using as well as the command used to start the process. The information for each process is divided into various columns. Here is what each column means.
PID: Process ID of a process
USER: User owning the process
PR: Priority of the process
NI: The nice value for a process
VIRT: Virtual memory consumption
RES: Physical RAM consumption in kilobytes
SHR: Shared memory consumption
S: Process status (S-sleeping, R- running, etc)
CPU%: CPU consumption
MEM%: Physical RAM consumption
TIME+: Processor time used by the process
COMMAND: Command that started the process
The footer displays the menu options.
Configuring Htop output
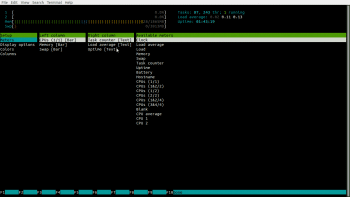
Meters: Htop displays only three bars in the header, but more can be added to and removed from it. To add or remove, press F2 -> Select ? Meters under Setup.
The Set up column shows the available settings, the column titled left column shows the list of columns displayed on the left side in the header section in the form of bars, whereas the column titled right column shows the list of columns displayed on the right side in the header section in the form of text.
Available meters shows the meters available that can be displayed in the header section.
To add meters, navigate to the appropriate column. Using arrow keys, select the meter you want to add and press F5 to add to the right and F6 to add to the left. Similarly, to delete a meter, navigate to the appropriate meter and press F9.
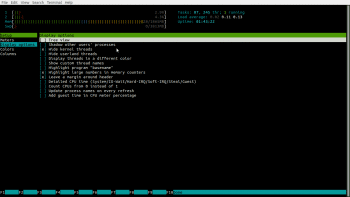
Display options: To customise display options, select Display options under Set up. Then select or deselect the option you want, and press F10 to save.
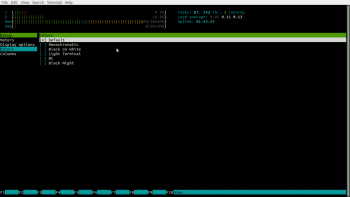
Colours: This option helps us choose different colours.
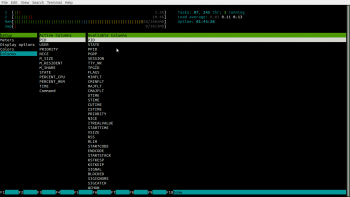
Columns: We can configure the columns displayed for processes and threads in the body section that we saw earlier. Press F2 -> Setup -> Columns. All the currently displayed columns are displayed under Active Columns. All the available columns are displayed under Available Columns. To add a column, click on the appropriate column name in Available Columns. Then click F5 -> Add. With this, the chosen column should show under Active Columns. You can adjust its place in the Htop output by clicking on it in Active Columns and moving it up or down with F7 or F8, respectively. You can remove a column from Active Columns with F9. With F10, you can save the settings and return to the Htop summary and process the list output.
In addition to all this, the footer displays some useful options like search, sort, kill and a few more that can really help you use Htop like a professional. Given below are some keys that will help you use Htop more effectively.
I: List open files used by a process
F6: Sort processes by any column
M: Sort processes by memory usage
P: Sort processes by processor usage
F3 or /: Search processes
F2: Enter set up
F9 or k: Kill a process
Command line options
Htop can also be executed with different options. Listed below are some of the command line options for Htop.
-d Delay between output updates
-C Run Htop with different colour modes
-p Display output for specific PIDs
-s Sort the output
-u Display processes for the specific user
-v Display Htop version
Htop is a useful utility. Its a simple and readable interface, has many configuration options and abilities to represent system data in different ways, and is a good choice for system monitoring. System monitoring is an essential part of any systems administrators job, and utilities like Htop are always supportive. Apart from Htop, there are several other open source tools like iostat, ps, vmstat, df and w, which are worth considering for monitoring system resources.


