Conventionally, the Internet has been used for data applications like email, chat, Web surfing, etc. Multimedia technology has been around for quite some time, but with the pace of development that it has enjoyed in the last few years, it has become an integral part of almost every Web endeavour. It finds application in fields ranging from video lectures to catalogues and games to video clips. The combination of multimedia technology and the Internet is currently attracting a considerable amount of attention from researchers, developers and end users.
Video transmission nowadays has become a necessity for almost every Internet user, irrespective of the device used to access the Internet. Typically, video transmission demands high bandwidth. Without compression, it is very difficult to transmit video over wired or wireless networks.
With the increasing use of multimedia-capturing devices and the improved quality of capture, the demand for high quality multimedia has gone up. The traditional protocols used to carry such volumes of multimedia data have started showing some limitations. Hence, enhanced protocols are the need of the hour. Researchers working on developing such protocols need platforms to test the performance of these newly designed protocols. The performance of the suite of protocols should ideally be measured on a real network. But due to several limitations of real networks, simulation platforms are commonly used to test prototypes.
This article is aimed at demonstrating the widely used and open source simulation platform, ns-2, for measuring the performance of protocols when multimedia content is transmitted over the network.
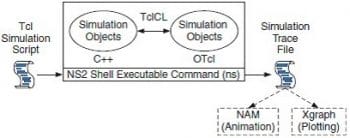
Architecture of ns-2 and EvalVid
Among researchers, network simulator 2 (ns-2) is one of the most widely used, maintained and trusted simulators. It is useful for simulating a wide variety of networks, ranging from Ethernet and wireless LANs, to ad hoc networks and wide area networks. The architecture of ns-2 is shown in Figure 1.
Conventionally, ns-2 supports constant bit rate and traffic in bursts, which resembles most of the data applications on the Internet. Multimedia traffic has characteristics that are different from data traffic. Data traffic is mostly immune to jitter and less sensitive to delay, whereas multimedia applications demand a high quality of service. Generating traffic representing multimedia data is very important when evaluating the performance of any network.
EvalVid is a framework and tool-set for evaluating the quality of video transmitted over a physical or simulated communication network. In addition to measuring the QoS (Quality of Service) parameters of the underlying network, like delays, loss rates and jitter, it also provides support for subjective video quality evaluation of the received video, based on frame-by-frame PSNR (Peak Signal to Noise Ratio) calculation. It can regenerate received video, which can be compared with the originally transmitted video in terms of many other useful metrics like video quality measure (VQM), structural similarity (SSIM), mean opinion score (MOS), etc. The framework of EvalVid is shown in Figure 2.
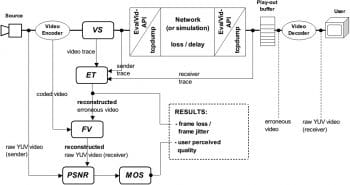
Integration of ns-2 and EvalVid
Raw video can be encoded by the required codec using tools provided by EvalVid. Video traces that contain information about video frames, like the frame type, time stamp, etc, are generated by using EvalVid. These trace files are used as a traffic source in ns-2. The integrated architecture of ns-2 and EvalVid is shown in Figure 3.
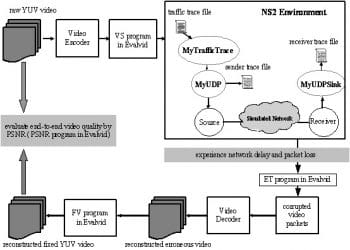
Scripting an agent in ns-2
Agents created in ns-2 need to read the generated video trace file. This agent code is easily available on the Internet. The following steps must be taken for integrating the agent code in ns-2.
Step 1: Put a frametype_ and sendtime_ field in the hdr_cmn header. The frametype_ field is to indicate which frame type the packet belongs to. The I frame type is defined to 1, P is defined to 2, and B is defined to 3. The sendtime_ field records the time the packet was sent. It can be used to measure end-to-end delay.
You can modify the file packet.h in the common folder as follows:
struct hdr_cmn {enum dir_t { DOWN= -1, NONE= 0, UP= 1 };packet_t ptype_; // packet type (see above)int size_; // simulated packet sizeint uid_; // unique idint error_; // error flagint errbitcnt_; //int fecsize_;double ts_; // timestamp: for q-delay measurementint iface_; // receiving interface (label)dir_t direction_; // direction: 0=none, 1=up, -1=down// source routingchar src_rt_valid;double ts_arr_; // Required by Marker of JOBS//add the following three linesint frametype_; // frame type for MPEG video transmissiondouble sendtime_; // send timeunsigned long int frame_pkt_id_; |
Step 2: You can modify the file agent.h in the common folder as follows:
class Agent : public Connector {public:Agent(packet_t pktType);virtual ~Agent();void recv(Packet*, Handler*);
..inline packet_t get_pkttype() { return type_; }// add the following two linesinline void set_frametype(int type) { frametype_ = type; }inline void set_prio(int prio) { prio_ = prio; }protected:int command(int argc, const char*const*argv);
..int defttl_; // default ttl for outgoing pkts// add the following lineint frametype_; // frame type for MPEG video transmission
..private:void flushAVar(TracedVar *v);}; |
Step 3: To modify the file agent.cc in the common folder, write the following code:
Agent::Agent(packet_t pkttype) :size_(0), type_(pkttype), frametype_(0),channel_(0), traceName_(NULL),oldValueList_(NULL), app_(0), et_(0){}
..Agent::initpkt(Packet* p) const{hdr_cmn* ch = hdr_cmn::access(p);ch->uid() = uidcnt_++;ch->ptype() = type_;ch->size() = size_;ch->timestamp() = Scheduler::instance().clock();ch->iface() = UNKN_IFACE.value(); // from packet.h (agent is local)ch->direction() = hdr_cmn::NONE;ch->error() = 0; /* pkt not corrupt to start with */// add the following linech->frametype_= frametype_;...... |
Step 4: Copy the myevalvid folder (which contains myevalvid.cc, myudp.cc, myudp.h, myevalvid_sink.cc and myevalvid_sink.h) into ns2.35; for example, ns-allinone-2.35/ns-2.35/myevalvid.
Step 5: To modify ns-allinone-2.35/ns-2.35/tcl/lib/ns-default.tcl, add the following two lines
Agent/myUDP set packetSize_ 1000Tracefile set debug_ 0 |
Step 6: To modify ns-allinone-2.35/ns-2.35/Makefile.in, put myevalvid/myudp.o, myevalvid/myevalvid_sink.o and myevalvid/myevalvid.o in the OBJ_CC list.
Step 7: Recompile ns-2 as follows:
./configure ; make clean ; make |
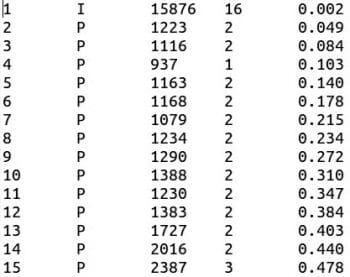
Formulating video traces from raw video and simulation
Assume that EvalVid and ns-2 are installed on Ubuntu. Similar steps will work on other Linux distros too.
Download a raw yuv video sequence (you can use known yuv videos from http://trace.eas.asu.edu/yuv/). Here is an example where bus_cif.yuv is used as raw video.
1. Encode the raw yuv file to m4v as follows:
$ffmpeg -s cif -r 30 -b 64000 -bt 3200 -g 30 -i bus_cif.yuv -vcodec mpeg4 bus_cif.m4v |
2. Convert the m4v file to mp4:
$MP4Box -hint -mtu 1024 -fps 30 -add bus_cif.m4v bus_cif2.mp4 |
As an option, you can create a reference yuv file. This video can be used for encoding loss estimation:
ffmpeg -i bus_cif2.mp4 bus_cif_ref.yuv |
3. Send an mp4 file per RTP/UDP to a specified destination host. The output of the mp4trace will be needed later, so it should be redirected to a file. The Source_Video_Trace file is the video trace file which has the information about each frame of the video and will be used by ns-2 as a traffic source.
$mp4trace -f -s 224.1.2.3 12346 bus_cif2.mp4 >Source_Video_Trace |
(A section of Source_Video_Trace is shown in Figure 4.)
4. Create a network topology representing the network to be simulated in Evalvid.tcl and run the simulation as follows:
$ns Evalvid.tcl |
5. After simulation, ns-2 will create two files, Send_time_file and Recv_time_file (the filename as used in the tcl file), which record the sending time and received time of each packet, respectively.
6. To reconstruct the transmitted video as it is seen by the receiver, the video and trace files are processed by etmp4 (Evaluate Traces of MP4-file transmission):
$etmp4 -f -0 -c Send_time_file Recv_time_file Source_Video_Trace bus_cif2.mp4 bus_cif_recv.mp4 |
This generates a (possibly corrupted) video file, in which all frames that got lost or were corrupted are deleted from the original video track. The reconstructed video will also demonstrate the effect of jitter introduced during packet transmission.
etmp4 also creates some other files, which are listed below:
loss_bus_cif_recv.txt contains I, P, B and overall frame loss in percentage.
delay_bus_cif_recv.txt contains frame-nr., lost-flag, end-to-end delay, inter-frame gap sender, inter-frame gap receiver, and cumulative jitter in seconds.
rate_s_bus_cif_recv.txt contains time, bytes per second (current time interval), and bytes per second (cumulative) measured at the sender and receiver.
The PSNR by itself does not mean much; other quality metrics that calculate the difference between the quality of the encoded video and the received video (which could be corrupted) can be used. Using a specialised tool like MSU, video quality in terms of VQM, SSIM can be measured, as transmitted and received videos are available.
7. Now, decode the received video to yuv format:
$ffmpeg -i bus_cif_recv.mp4 bus_cif_recv.yuv |
8. Compute the PSNR:
psnr x y <YUV format> <src.yuv> <dst.yuv> [multiplex] [ssim]$psnr 352 288 420 bus_cif2.yuv bus_cif_recv.yuv > ref_psnr.txt |
Simulating an experimental set-up
All relevant files for simulation can be downloaded from https://www.opensourceforu.com/article_source_code/july15/vt_ns2.zip.
Performance evaluation
We can plot the graph PSNR as mentioned in Step 8. We can also plot other quality metrics like VQM and SSIM.
References
[1] Klaue, Jirka, Berthold Rathke, and Adam Wolisz;EvalvidA framework for video transmission and quality evaluation. Computer Performance Evaluation. Modelling Techniques and Tools. Springer Berlin Heidelberg, 2003. 255-272.
[2] http://www2.tkn.tu-berlin.de/research/evalvid/EvalVid/docevalvid.html source file.





Article source code is not available on the provided link. Can you provide the updated link?
jitendra.bhatia@nirmauni.ac.in, this mail id is not valid. mails couldn’t send to this mail-id. Kindly give a updated one. thank you.