Docker brings in portability to technology-intensive software development environments. As a result, it has become quite popular among developers to demonstrate a proof-of-concept, technology preview release through the use of Docker containers.
At the same time, Docker runs UNIX processes on Linux with strong guarantees of isolation, thanks to Linux kernel technologies like namespaces and control groups (cgroups). This has disrupted the entire deployment and operations space and proven Docker to be a great building block for automating software infrastructure, namely, large-scale Web deployments, databases, private Platforms as a Service (PaaS), continuous deployment systems and service-oriented infrastructures (SOA), among others.
In simple terms, the Docker runtime itself is a container based PaaS platform.
Blueprints of monitoring infrastructure
In any infrastructure, the resources that are at stake are computing power (CPU), memory (RAM), networking (LAN) and storage (HDD). Virtualisation brought in hardware resource utilisation and configurable limits, leading to efficiency. However, containerisation disrupted the entire game with frugal system resource utilisation, powered by operating system software capabilities, thanks to namespaces and cgroups.
As a result, one can run thousands of dockerised portable apps on commodity hardware, driving forward significant efficiency and scale on the same platform that earlier struggled under the virtualisation workload of tens of operating systems.
Given this flexibility, it is entirely possible that a bunch of resource-hungry applications can significantly reduce the performance of the other dockerised apps. The objective of monitoring is to precisely address this important case by collecting operating system level metrics and having a mechanism to manage the apps to ensure scalability. This article highlights monitoring within this context.
Namespaces in the Linux kernel
In the Linux kernel, the six namespaces are mount, uts, ipc, pid, net and user, which provide isolation of the systems resources. It is important to understand that namespaces and control groups are orthogonal by design.
Each process has a /proc/[pid]/ns sub-directory containing one entry for each namespace that supports being modified. Heres a simple example:
$ psPID TTY TIME CMD2551 pts/0 00:00:01 bash15432 pts/0 00:00:00 ps$ ls -al /proc/2551/nstotal 0dr-x--x--x 2 saifi users 0 Apr 8 21:29 ./dr-xr-xr-x 9 saifi users 0 Apr 8 12:24 ../lrwxrwxrwx 1 saifi users 0 Apr 8 21:29 ipc -> ipc:[4026531839]lrwxrwxrwx 1 saifi users 0 Apr 8 21:29 mnt -> mnt:[4026531840]lrwxrwxrwx 1 saifi users 0 Apr 8 21:29 net -> net:[4026531956]lrwxrwxrwx 1 saifi users 0 Apr 8 21:29 pid -> pid:[4026531836]lrwxrwxrwx 1 saifi users 0 Apr 8 21:29 user -> user:[4026531837]lrwxrwxrwx 1 saifi users 0 Apr 8 21:29 uts -> uts:[4026531838]$ |
The corollary to this approach is the implementation of the nsenter program, which is part of the util-linux package, which lets a user run a program with the namespace of other processes.
Control groups in the Linux kernel
Since we also need access to kernel data structures, it is useful to work with a dynamic file system interface like /proc/mounts to extract information about control groups (cgroups).
cgroup /sys/fs/cgroup/systemd cgroup rw,nosuid,nodev,noexec,relatime,xattr,release_agent=/usr/lib/systemd/systemd-cgroups-agent,name=systemd 0 0pstore /sys/fs/pstore pstore rw,nosuid,nodev,noexec,relatime 0 0cgroup /sys/fs/cgroup/cpuset cgroup rw,nosuid,nodev,noexec,relatime,cpuset 0 0cgroup /sys/fs/cgroup/cpu,cpuacct cgroup rw,nosuid,nodev,noexec,relatime,cpu,cpuacct 0 0cgroup /sys/fs/cgroup/memory cgroup rw,nosuid,nodev,noexec,relatime,memory 0 0cgroup /sys/fs/cgroup/devices cgroup rw,nosuid,nodev,noexec,relatime,devices 0 0cgroup /sys/fs/cgroup/freezer cgroup rw,nosuid,nodev,noexec,relatime,freezer 0 0cgroup /sys/fs/cgroup/net_cls,net_prio cgroup rw,nosuid,nodev,noexec,relatime,net_cls,net_prio 0 0cgroup /sys/fs/cgroup/blkio cgroup rw,nosuid,nodev,noexec,relatime,blkio 0 0cgroup /sys/fs/cgroup/perf_event cgroup rw,nosuid,nodev,noexec,relatime,perf_event 0 0cgroup /sys/fs/cgroup/hugetlb cgroup rw,nosuid,nodev,noexec,relatime,hugetlb 0 0 |
This is what we need in order to collect system level metrics. Lets now focus on Docker.
Docker infrastructure
Docker implements a high-level API, which operates at the process level. To successfully monitor Docker container infrastructure, dynamic system-level access is required to the runtime, together with the systems view.
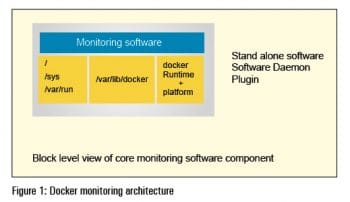
In short, we use the dynamic file system interface, and map it using volume functionality in the Docker runtime to collect the data that we seek. Thus, what we need is the following:
//var/run/sys/var/lib/docker |
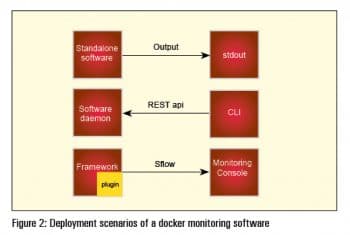
Figure 1 highlights the architectural blueprint for monitoring software, which is structured either as standalone software, as a software daemon or as a software plugin that is loaded and managed as part of a framework.
Available software
The software should be able to tell us what containers are running, provide a live view of the resources consumed within the containers, and give statistical analysis.
The first set of software that addressed this opportunity were the server monitoring frameworks that added on a Docker monitoring plugin. The Scout server monitoring framework repurposed its LXC monitoring solution to Docker containers. This was the approach adopted by open source equivalents like Zabbix and Icinga as well.
Commercial offerings that showed up included DataDog, a monitoring service that added Docker monitoring capability to its myriad enterprise monitoring and visualisation features.
Agent-driven open source general-purpose monitoring frameworks like host sFlow released support for Docker containers, exporting standard sFlow performance metrics for LXC containers and unifying it as part of the sFlow ecosystem that encompasses applications, virtual servers, virtual networks, servers and networks.
cAdvisor
cAdvisor or container advisor is open source software that has native support for Docker containers, and is designed as a daemon that collects, aggregates, processes and exports information about running containers.
In this write-up, we wont go into the details of how to compile or build cAdvisor; instead, we will focus on using a ready-to-run cAdvisor image from hub.docker.com and then run the image.
First, we need to set up the Docker environment and then enable it using systemctl. If you are on a distro that does not use systemd, then /etc/init.d/docker would be the most common command to start Docker.
$ sudo systemctl status dockerroots password:docker.service - DockerLoaded: loaded (/usr/lib/systemd/system/docker.service; disabled)Active: inactive (dead)$ sudo systemctl enable docker$ sudo systemctl status dockerdocker.service - DockerLoaded: loaded (/usr/lib/systemd/system/docker.service; enabled)Active: inactive (dead)$ sudo systemctl start docker$ sudo systemctl status dockerdocker.service - DockerLoaded: loaded (/usr/lib/systemd/system/docker.service; enabled)Active: active (running) since Wed 2015-04-08 21:15:59 IST; 14h agoMain PID: 14880 (docker)CGroup: /system.slice/docker.service+-14880 /usr/bin/docker -dApr 08 21:15:59 beijing.site docker[14880]: time=2015-04-08T21:15:59+05:30 level=info msg=+job serveapi(unix:///var/run/...sock)Apr 08 21:15:59 beijing.site docker[14880]: time=2015-04-08T21:15:59+05:30 level=info msg=+job init_networkdriver()Apr 08 21:15:59 beijing.site docker[14880]: time=2015-04-08T21:15:59+05:30 level=info msg=Listening for HTTP on unix (/v...sock)Apr 08 21:16:00 beijing.site docker[14880]: time=2015-04-08T21:16:00+05:30 level=info msg=-job init_networkdriver() = OK (0)Apr 08 21:16:00 beijing.site docker[14880]: time=2015-04-08T21:16:00+05:30 level=info msg=WARNING: Your kernel does not ...imit.Apr 08 21:16:00 beijing.site docker[14880]: time=2015-04-08T21:16:00+05:30 level=info msg=Loading containers: start.Apr 08 21:16:00 beijing.site docker[14880]: time=2015-04-08T21:16:00+05:30 level=info msg=Loading containers: done.Apr 08 21:16:00 beijing.site docker[14880]: time=2015-04-08T21:16:00+05:30 level=info msg=docker daemon: 1.5.0 a8a31ef; ...btrfsApr 08 21:16:00 beijing.site docker[14880]: time=2015-04-08T21:16:00+05:30 level=info msg=+job acceptconnections()Apr 08 21:16:00 beijing.site docker[14880]: time=2015-04-08T21:16:00+05:30 level=info msg=-job acceptconnections() = OK (0)Apr 08 21:17:28 beijing.site docker[14880]: time=2015-04-08T21:17:28+05:30 level=info msg=GET /v1.17/versionApr 08 21:17:28 beijing.site docker[14880]: time=2015-04-08T21:17:28+05:30 level=info msg=+job version()Apr 08 21:17:28 beijing.site docker[14880]: time=2015-04-08T21:17:28+05:30 level=info msg=-job version() = OK (0)Hint: Some lines were ellipsized, use -l to show in full. |
Once you have verified that the Docker service is running fine, you need to add yourself to the Docker group.
$ sudo usermod -a -G docker saifi |
To verify which groups you are part of, just issue the following command:
$ groups |
In addition, you need to create an account at hub.docker.com so that you can work with the cAdvisor image. Just visit the website https://hub.docker.com/ and sign up with your username, password and email address. Please make sure that you have verified your email address.
Once you have done this, from a terminal, attempt to issue the following command and fill in the details, as follows:
$ docker loginusername:password:email: |
Should you subsequently see an error like this: /var/run/docker.sock: permission denied, then the permissions need to be fixed. What needs to be done for this is shown below:
$ ls -l /var/run/docker*-rw-r--r--1 root root 4 Apr 9 11:17 /var/run/docker.pidsrw-rw---- 1 root docker 0 Apr 9 11:17 /var/run/docker.sock= |
We need to replace root by your login name on the machine (for example, Saifi, in this case) for the docker.sock
$ sudo chown saifi:docker /var/run/docker.sockroots password:$ ls -l /var/run/docker*-rw-r--r-- 1 root root 4 Apr 9 11:17 /var/run/docker.pidsrw-rw---- 1 saifi docker 0 Apr 9 11:17 /var/run/docker.sock= |
Now, the login should go through.
Next, pull in the cAdvisor image from the Docker hub. We are using the compiled cAdvisor image that is hosted in a repository at https://registry.hub.docker.com/u/saifikhan/cadvisor/
$ docker pull saifikhan/cadvisor |
You will see an output like whats shown below:
Pulling repository saifikhan/cadvisor2d37849cf381: Download complete511136ea3c5a: Download completee2fb46397934: Download complete015fb409be0d: Download complete21082221cb6e: Download completebbd692fe2ca1: Download complete8db8f013bfca: Download complete7fff0c6f0b8d: Download complete7acf13620725: Download complete6f114d3139e3: Download complete7e65318a255c: Download completed9065eab4487: Download completeStatus: Downloaded newer image for saifikhan/cadvisor:latest$ |
A list of images on your system can be seen,
as shown below:
$ docker imagesREPOSITORY TAG IMAGE ID CREATED VIRTUAL SIZEsaifikhan/cadvisor latest 2d37849cf381 3 months ago 17.51 MB |
Now that we have the image, we need to run it:
$ sudo docker run --volume=/:/rootfs:ro --volume=/var/run:/var/run:rw --volume=/sys:/sys:ro --volume=/var/lib/docker/:/var/lib/docker:ro --publish=8080:8080 --detach=true --name=cadvisor saifikhan/cadvisor:latestroots password:ed989c9382706ad5ac322ffedffd0f5409167ff95736b36d12af3cadc1e06850 |
Verify that the image is running using the following commands:
$ docker psCONTAINER ID IMAGE COMMAND CREATED STATUS PORTS NAMESed989c938270 saifikhan/cadvisor:latest /usr/bin/cadvisor 3 seconds ago Up 2 seconds 0.0.0.0:8080->8080/tcp cadvisor$ |
Please start your browser and type in the following address:
http://localhost : 8080/ |
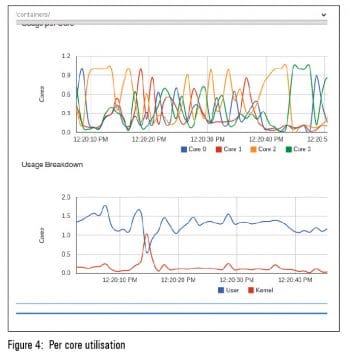
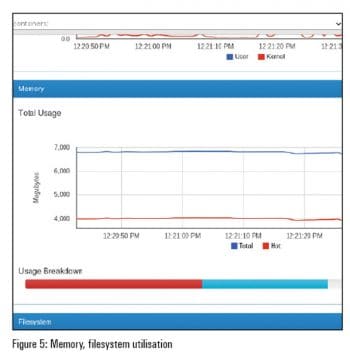
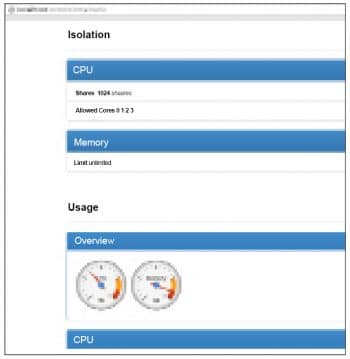
You should see a page that lists all the Docker containers running on your machine. Do look at Figures 1, 2 and 3 to get an idea.
Finally, when you are satisfied, you can stop the Docker container:
$ docker psCONTAINER ID IMAGE COMMAND CREATED STATUS PORTS NAMESed989c938270 saifikhan/cadvisor:latest /usr/bin/cadvisor 27 minutes ago Up 27 minutes 0.0.0.0:8080->8080/tcp cadvisor$ sudo docker stop ed989c938270roots password:ed989c938270$ docker psCONTAINER ID IMAGE COMMAND CREATED STATUS PORTS AMES$ |
cAdvisor as a daemon is fairly versatile; it exports a REST API interface and supports a native storage driver for real-time time series database influxDB. When influxDB is configured to pull in the data from cAdvisor, it can perform statistical analysis of the data stream and provide rate information, e.g., context switches per second, memory page faults, etc.
cAdvisor tracks on a per-container basis the resource isolation parameters based on cgroups and namespace information, historical resource usage and network statistics. From a deployment perspective, cAdvisor can be used along with influxDB, a distributed time series database, and Grafana, an open source, feature-rich, metrics dashboard and graph editor for influxDB which works entirely from the browser environment to generate client-side graphs.
cAdvisor as an open source tool is the starting point for Docker container resource monitoring. There are further fine grained controls that can be adopted by writing scripts that manipulate the dynamic file system interface of cgroups and namespaces. In due course, many of these capabilities would either show up in the tool itself, or the ecosytem around the tool will bring in the capabilities.
References
[1] cAdvisor: https://github.com/google/cadvisor
[2] influxDB: http://influxdb.com/
[3] Grafana http://grafana.org/


