Packet capture is a classic, frequently performed task carried out by network administrators. This is done to detect any suspicious activity in the network. Any out-of-the-way or abnormal activity is analysed by intrusion detection system (IDS) tools in order to classify the attack or the type of traffic. There are numerous IDS tools available, including open source products, that classify the attacks or traffic based on information gathered from the PCAP (packet capture) files fetched from honey pots or servers.
PCAP (packet capture)
Issues of intrusion in the network by different media can be tackled by making use of PCAP (packet capture), which has an application programming interface (API) for capturing network traffic from ports, IP addresses and associated parameters. In the case of UNIX-like systems, PCAP is implemented in the Libpcap library. In Windows, it is implemented through WinPcap, which is the Windows version of Libpcap.
The base API of PCAP is in the C programming language. To implement PCAP in other programming languages such as Java, .NET and Web-based scripting languages, a wrapper is used, but remember that neither Libpcap nor WinPcap provide these wrappers by default. In the case of C++, the programs can link directly to the C API or make use of an object-oriented wrapper.
The MIME type for the file format that is created and read by Libpcap is application/vnd.tcpdump.pcap. The classical file extension for PCAP is .pcap. In some tools, .cap and .dmp file extensions are also used.
Libpcap and WinPcap are associated, in terms of packet capturing as well as filtering engines, with many open source and commercial network tools. These include protocol analysers (packet sniffers), network investigators, network IDEs, traffic generators and network analysers.
A feature of Libpcap is that the captured files can be exported and saved to a file. A captured file that is saved in the format that Libpcap and WinPcap use can be easily analysed by applications that understand this format, including tcpdump, Wireshark, NetworkMiner and many others.
Tools for reading Libpcap
Here is a list of network analysis tools that make use of Libpcap.
- Tcpdump: A tool to capture and dump packets for forensics and investigation.
- ngrep (Network Grep): Shows packet data in a user-friendly output scenario.
- Wireshark (earlier called Ethereal): A GUI-based packet-capturing and protocol forensic tool.
- Snort: An open source network intrusion detection system.
- Nmap: A port-scanning and fingerprinting network utility.
- Bro IDS: An IDS and network analysis tool.
- URL Snooper: Locates the addresses of audio and video files to enable recording them.
- Iftop: Displays the usage of bandwidth in the network.
- EtherApe: GUI-based tool for monitoring network traffic and bandwidth usage in real time.
- Bit-Twist: Ethernet packet generator.
- Pirni: Network security tool used with jailbroken iOS devices.
- Firesheep: An extension for the Mozilla Firefox Web browser. It intercepts the unencrypted cookies from different websites. It is also used for session hijacking and network vulnerabilities.
- Suricata: A network intrusion analysis and prevention platform.
- WhatPulse: A statistical measurement tool (input, network, uptime, etc) in the network.
- Xplico: A network forensics analysis tool (NFAT).
Snort
Snort is an open source tool developed by Sourcefire and written in C. It is used as a network intrusion prevention as well as a network intrusion detection system. It is an excellent combination of signature, protocol and anomaly-based inspection. Snorts user statistics are impressive with millions of downloads and nearly 400,000 registered users. It is not only an IDS but is also used as an IPS (Intrusion Prevention System) to avoid any unwanted activity or unauthorised access to resources. Snort can easily implement protocol analysis and content investigation with a number of other features. The excellent features of the tool include detection of a variety of attacks and probes such as buffer overflows, stealth port scans, CGI attacks, SMB probes, OS fingerprinting attempts and many others.The main configuration file is /etc/snort/snort.conf. In this, the actual information about the network or system under investigation is specified. All values and parameters are commented in the file so that the changes can be made very easily.
Other free intrusion detection systems (IDS)
Other free intrusion detection systems are given below:
- ACARM-ng
- AIDE
- Bro NIDS
- OSSEC HIDS
- Prelude Hybrid IDS
- Samhain
- Suricata
Different modes for Snort network forensics
Snort can be configured in three different modes.
Sniffer mode: Sniffer mode is used to read the packets of the network and display them to the user in a continuous stream on the system.
Packet logger mode: Packet logger mode is used to log the packets to the disk.
Network IDS mode: Network IDS mode is associated with configurable parameters that allow the tool to analyse network traffic by matching it against specific user-defined rules. Finally, it performs several actions based on what the tool investigates at the time of execution.
Sniffer mode
To view only the TCP/IP packet headers to the screen, the following command is used:
./snort -v
This will execute Snort and show the IP and TCP/UDP/ICMP headers.
To display the application data in transit, the following command is used:
./snort -vd
With this, Snort displays the packet data as well as the headers.
To view a detailed analysis or description, showing the data link layer headers, use the following command:
./snort -vde
This command, with different switches, can also be executed as:
./snort -d -v e
Packet logger mode
To record the packets to a disk, we need to specify the directory for logging. Snort will automatically execute the packet logger mode:
./snort -dev -l ./log
Running in this mode, Snort will collect every data packet that it encounters and place it in a directory hierarchy that is based upon the IP address of one of the hosts in the datagram.
If you specify a switch -l, you will see that Snort uses the address of the remote computer as the directory in which it places packets. In some scenarios, it makes use of the local host address. For the logging of packets relative to the home network, you have to specify this network with the following command:
./snort -dev -l ./log -h 192.168.1.0/24
This command and rule will specify that you want to view the data link and TCP/IP headers as well as application data into the directory ./log, and log the packets relative to the 192.168.1.0 class C network. All incoming data packets will be recorded in the sub-directories of the main directory log with the names of the directory based on the address of the remote host. If you are working on a high speed network or want to log the packets in a compressed form for later analysis, consider logging in binary mode.
In the binary mode, the logging of the packets is done in the tcpdump format to a single binary file in the logging directory:
./snort -l ./log -b
We should note that we have not specified a home network in the command above because the binary mode logs everything to a single file, in which there is no need to specify how to format the output directory structure.
Network intrusion detection mode
To run the tool in network intrusion detection (NIDS) mode, execute the following command:
./snort -dev -l ./log -h 192.168.1.0/24 -c snort.conf
snort.conf is the name of the file that has different rules. The rules set is applied from the snort.conf file to each packet to finally decide whether or not to take a particular action based upon the rule type in the file. If we do not specify the output directory for the program, it will be /var/log/snort by default.
Reading PCAP using Snort and alert files
PCAP files can be analysed very easily using Snort. The PCAP file is passed with a Snort command. Once the command is executed, Snort generates the alert file from that specific PCAP file.
To read a single PCAP file, use the following commands:
$ snort -r mynetwork.pcap
$ snort --pcap-single= mynetwork.pcap
To read multiple PCAPS from a file, use the following:
$ cat mypcaps.txt
pcap1.pcap
pcap2.pcap
$ snort --pcap-file=mypcaps.txt
This command will read pcap1.pcap, pcap2.pcap and all files under /home/mynetwork/pcaps. Snort will not attempt to check whether the files under that directory are really PCAP files or not.
To read PCAPS from a command line list, use the following command:
$ snort --pcap-list=MyNetwork1.pcap MyNetwork2.pcap MyNetwork3.pcap
This will read MyNetwork1.pcap, MyNetwork2.pcap and MyNetwork3.pcap.
To read PCAPS under a directory, type:
$ snort --pcap-dir=/home/MyNetwork/pcaps
This will include all of the files under /home/MyNetwork/pcaps.
You can also use filters to read a PCAP file:
$ cat MyNetwork.txt
MyNetwork1.pcap
MyNetwork2.pcap
Here, the current directory is /home/MyNetwork/pcaps
$ snort --pcap-filter=*.pcap --pcap-file=MyNetwork.txt $ snort --pcap-filter=*.pcap --pcap-dir=/home/MyNetwork/pcaps
The above will only include files that match the shell pattern *.pcap; in other words, any file ending in .pcap.
$ snort --pcap-filter=*.pcap --pcap-file=MyNetwork.txt \ > --pcap-filter=*.cap --pcap-dir=/home/MyNetwork/pcaps
In the above, the first filter *.pcap will only be applied to PCAP files in the file MyNetwork.txt (and any directories that are recursed in that file). The addition of the second filter *.cap will cause the first filter to be forgotten and then be applied to the directory /home/MyNetwork/pcaps; so only files ending in .cap will be included from that directory.
$ snort --pcap-filter=*.pcap --pcap-file=MyNetwork.txt \ > --pcap-no-filter --pcap-dir=/home/MyNetwork/pcaps
In this example, the first filter will be applied to MyNetwork.txt. Subsequently, no filter will be applied to the files found under /home/MyNetwork/pcaps; so all the files found under it will be included.
$ snort --pcap-filter=*.pcap --pcap-file=MyNetwork.txt \ > --pcap-no-filter --pcap-dir=/home/MyNetwork/pcaps \ > --pcap-filter=*.cap --pcap-dir=/home/MyNetwork/pcaps2
In this example, the first filter will be applied to MyNetwork.txt. Subsequently, no filter will be applied to the files found under /home/MyNetwork/pcaps; so all files found under it will be included. Then, the filter *.cap will be applied to files found under /home/MyNetwork/pcaps2.
Printing the PCAPS
$ snort --pcap-dir=/home/MyNetwork/pcaps --pcap-show
The above example will read all the files under /home/MyNetwork/pcaps and will print a line indicating which PCAP is currently being read.
Snorts full file format
From the specified alert file given below that is fetched by Snort, we can plot the graphs/charts or any other pattern related to data mining.
[**] [1:2010935:2] ET POLICY Suspicious inbound to MSSQL port 1433 [**]
[Classification: Potentially Bad Traffic] [Priority: 2]
07/25-20:31:31.817217 232.11.237.105:1000 -> 233.29.20.24:1433
TCP TTL:102 TOS:0x0 ID:256 IpLen:20 DgmLen:40
******S* Seq: 0x43EE0000  Ack: 0x0  Win: 0x4000  TcpLen: 20
[Xref => http://doc.emergingthreats.net/2010935]

[**] [1:2010935:2] ET POLICY Suspicious inbound to MSSQL port 1433 [**]
[Classification: Potentially Bad Traffic] [Priority: 2]
07/25-20:31:31.838622 17.1.27.05:6000 -> 23.12.20.17:1433
TCP TTL:103 TOS:0x0 ID:256 IpLen:20 DgmLen:40
******S* Seq: 0x6D5F0000  Ack: 0x0  Win: 0x4000  TcpLen: 20
[Xref => http://doc.emergingthreats.net/2010935]

[**] [1:2010935:2] ET POLICY Suspicious inbound to MSSQL port 1433 [**]
[Classification: Potentially Bad Traffic] [Priority: 2]
07/25-20:31:31.898603 17.1.27.5:6000 -> 23.19.20.22:1433
TCP TTL:103 TOS:0x0 ID:256 IpLen:20 DgmLen:40
******S* Seq: 0x262F0000  Ack: 0x0  Win: 0x4000  TcpLen: 20
[Xref => http://doc.emergingthreats.net/2010935]
Extraction of relevant patterns and data from Alert files using Notepad++
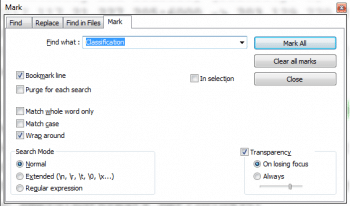
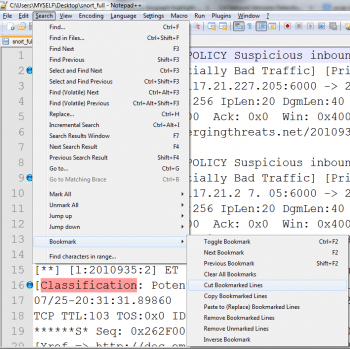
Once the alert file is generated, it can be opened in Notepad++, which has the unique feature of bookmarking specific lines. To separate the lines that have Classification, Priority and IPLen from the Alert file, the Find and bookmark feature can be used.
Once the lines are marked with bookmarks, you can easily cut these selected lines.
Finally, lets paste these lines to a separate file, and the following file will be generated:
[Classification: Potentially Bad Traffic] [Priority: 2] Dgmlen: 233
[Classification: Potentially Bad Traffic] [Priority: 2] Dgmlen: 233
[Classification: Potentially Bad Traffic] [Priority: 2] Dgmlen: 234
[Classification: Potentially Bad Traffic] [Priority: 2] Dgmlen: 232
[Classification: Potentially Bad Traffic] [Priority: 2] Dgmlen: 234
[Classification: Potentially Bad Traffic] [Priority: 2] Dgmlen: 231
[Classification: Potentially Bad Traffic] [Priority: 2] Dgmlen: 232
[Classification: Potentially Bad Traffic] [Priority: 2] Dgmlen : 231
[Classification: Potentially Bad Traffic] [Priority: 2] Dgmlen : 232
[Classification: Potentially Bad Traffic] [Priority: 2] Dgmlen : 230
The extracted alert file can be moved to a spreadsheet package to plot graphs or apply any formula using the following steps:
- In MS-Word => Use Find-Replace for replacing every paragraph with a tab
- For this, simply replace SPACE with ^t
- It will generate the file with fields separated by tabs
- Copy the full file with the tab to MS-Excel
- MS-Excel will place all tab fields in different columns
- Now, you can easily apply any formula
Using this method, you can get the following type of output in the Spreadsheet Package:
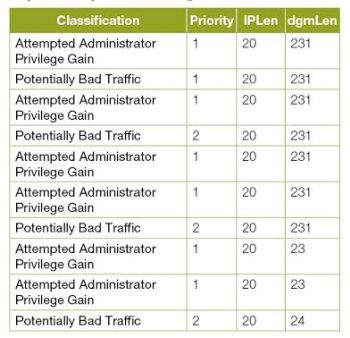
This method can be used to analyse any network traffic captured by APIs like PCAP, enabling detailed investigation of the packets and associated parameters.


