 Discover how to use Systemtap Dtrace style markers, which can be a great aid in a production environment to monitor the program flow.
 Debugging has become integral to a programmers life. In C and C++, we normally debug using printf()s/ couts, gdb, valgrind, etc. SDT markers are very handy due to their simplicity yet great debugging capabilities.
What are SDT markers?
The abbreviation stands for ’Systemtap Dtrace’ style markers. They are statically placed user space markers which can later be probed dynamically for some useful information.
Why use them?
SDT markers are normally placed at important spots in programs and can later be probed for some useful information; for instance, if you want to determine the code flow, the values of some important variables, etc. This information is what we look for while debugging.
SDT markers are being quite widely used now. For example, applications/libraries like PostgreSQL, MySQL, Mozilla, Perl, Python, Java, Ruby, libvirt, QEMU, glib, etc have these markers embedded in them. Most of us arent even aware of them but a quick scan of a standard Fedora 20 system will show a total of over 4000 SDT markers. However, this may not be true for other distros.
How to use SDT markers
Using SDT markers is very simple. You have to include the <sys/sdt.h> header in your program. If this header file is absent, then install the systemtap-sdt-devel package for Fedora, RedHat and related distros. For distros like Ubuntu and Debian, the package name is systemtap-sdt-dev. After including the header file, you just have to use a variant of the macro STAP_PROBE (provider_name, marker_name) wherever you want the marker to be placed.
The arguments provider_name and marker_name are very important. They establish the identity of the marker. Here is a simple example to show how SDT markers are used:
#include <stdio.h>#include <sys/sdt.h> /* Include this header file */ int main(void){ printf(In main\n); STAP_PROBE(test, in_main); return 0;} |
Using them is fairly simple. Also, compilation doesnt involve any tricks. Just the same old:
$ gcc test.c -o test |
Lets probe and trace the markers.
Probing and tracing markers with Systemtap
Using SDT markers wont give us anything unless we probe and trace them. For this, we need a tool called Systemtap.
Systemtap, developed by RedHat, is a very powerful debugging and performance analysis tool thats widely used these days. You need to install the packages systemtap and systemtap-runtime. In Fedora and RedHat-based systems, run the following command:
yum install systemtap systemtap-runtime |
If you face any problems with the installation and usage, go to the site: https://sourceware.org/systemtap/ and access the beginners guide, which shouldn’t be very hard to follow. User space probing functionality takes help from the uprobes infrastructure which has been present in the kernel since kernel version 3.5. To check your kernel version, use the following command:
$ uname -r |
And to check if the uprobes functionality is available, use:
$ grep CONFIG_UPROBES /boot/config-`uname -r` |
which should show you the following:
CONFIG_UPROBES=y |
After you make sure that Systemtap is installed, open another terminal to run stap.
In one terminal, issue the following code:
# stap -v -e probe process(/home/user/test).mark(in_main) { printf(Marker in_main Hit\n); } |
What we have done here is run a Systemtap script from the command line mentioning that we need to probe executable with path as /home/user/test, and the marker we need to probe into is in_main. And if control hits the marker, we must display Marker in_main Hit. The option -e is to instruct stap that we are providing the script on the command line itself and -v is to display a verbose output.

Run this command and you will find that after five passes (refer to Figure 1), it just waitsfor the program to be run and the marker to be hit. So, in another terminal, run the program with the marker and see the result in the terminal running Systemtap (refer to Figure 2).
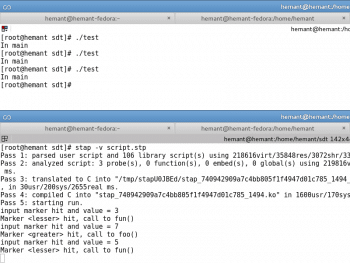
How does this help? You can place these markers (any number of them) in programs to determine the code flow. One can argue that it would be much simpler to use printf()s instead of these markers to determine the code flow. But every time you run the program, a lot of unnecessary data is displayed. We dont want that, nor do we want to interfere with the programs output. We want the data to be displayed only when we need it. SDT markers are dormant. They can never do anything on their own. Only when somebody needs more information, the markers can be probed with tools like Systemtap to find out the details.
SDT markers with arguments
Only finding out the hits on SDT markers isnt enough. Lets get some more information at a particular point in the program about some important variables. Thats where the arguments come to the fore. Here is a simple program showing their usage:
#include <stdio.h>#include <sys/sdt.h>int main(void){int no;printf(scanf(%d, &no);STAP_PROBE1(test, input, no);if (no > 5) {STAP_PROBE(test, greater);foo();} else {STAP_PROBE(test, lesser);fun();}} |
In the above code snippet, we have used three markers. Again, the program isnt important but the usage of the marker is. See the first one: STAP_PROBE1. Notice 1′ as the suffix? This specifies that you are sending one argument, which in this case is no. Similarly, if we use two arguments, then the suffix would be 2′. It can go on till 12. After that, you have to specify N for N number of arguments. For more information on this, skim through <sys/sdt.h>.
Now, compile the program. This time, lets write a script for Systemtap to be executed in a file (not in the command line). Systemtap scripts should end with .stp. Here is the script:
probe process(/home/hemant/backup/home_backup/prac/test).mark(input) {printf(input marker hit and value = %d\n, $arg1);}probe process(/home/hemant/backup/home_backup/prac/test).mark(greater) {printf(Marker <greater> hit, call to foo()\n);}probe process(/home/hemant/backup/home_backup/prac/test).mark(lesser) {printf(Marker <lesser> hit, call to fun()\n);} |
Systemtap uses C-style statements like printf(). The first probe point is important. We are asking Systemtap to print the value $arg1. If we had to use more arguments, then we would have used $arg2, $arg3, etc, to retrieve those values. To run this script, use:
$ stap -v script.stp |
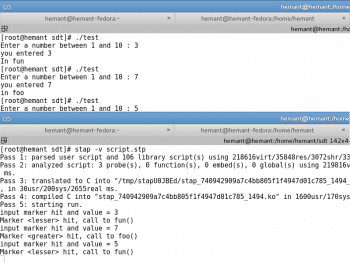
You can refer to Figure 3. Remember to run the program in another terminal. We can also send a string pointer as an argument and print that in the script. You are free to try that.
Heres a look at what happens behind the scenes.
Location of SDT markers in the ELF
The standard format for object code in Linux is Executable and Linkable Format (ELF). We know that an ELF consists of sections (like the .data, .rodata, .text, etc). When we compile a program containing SDT markers, two sections called .note.stapsdt and .base.stapsdt are created (sometimes, three sections including .probes, but thats only if we use semaphores). How does it happen? Well, if you look closely into the <sys/sdt.h>, the preprocessor converts the STAP_PROBE() macro variants into asm directives. This can be verified using the C preprocessor command cpp.
The asm directives help in creating these sections (.note.stapsdt and .base.stapsdt) and embedding the information about the markers into them.
The important section is .note.stapsdt which contains the information about all the SDT markers, like their name, provider, location in the object code, etc. Let us look at the first program (containing a single marker) shown earlier, as an example.
Compile that program:
$ gcc test.c -o test |
Now, use the command readelf to see if those sections were created:
$ readelf -S ./test |
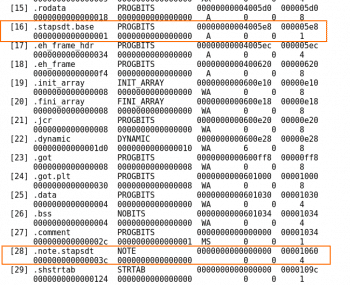
Refer to Figure 4.
We can clearly see the section .note.stapsdt present. To view the contents of this section, one can either use objdump -dt ./test and then look for this section and its contents, or the much subtler way is to use readelf to read all the notes information. SDT markers are actually notes with type as stapsdt.
Note that the ALLOC bits for the section .note.stapsdt are set off. That means this section wont be loaded into memory when the program is loaded to run. How does this help? If we have a large number of SDT markers being used, this might take up a large amount of space in the memory; hence, its better not to load it.
$readelf -n ./test |
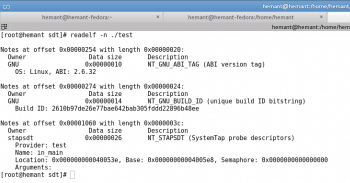
The output in Figure 5 displays information about all the notes present in that program. The last one is an SDT note. We know that because we can see that the owner of that note is stapsdt. SDT notes have stapsdt as their owner. That defines their type.
Here, we find the type of note, provider name, marker name, the location in the program and some other information including a semaphore address. Lets ignore the semaphore address for now. The location shown here is 0x40053e. If, in the object code we find the instruction at the following address:
$ objdump -dt ./test | grep 40053e |

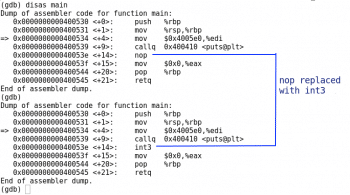
the instruction at this address will be nop, as shown in Figure 6.
So, the place at which we placed our marker has been replaced with a nop. This can also be seen from the assembler directives which replace the macro STAP_PROBE() where a nop instruction is placed. And since the SDT markers are replaced with nop’s, they are dormant (when not being probed).
Probing that location
When we probe the marker using Systemtap, the section .note.stapsdt is retrieved. From this section, the information about all the SDT notes/markers is also retrieved. After obtaining the information about the note, the location of the SDT marker and the executable path is sent to the kernels uprobes interface. It replaces the nop instruction with an int3 instruction, which is a trap (refer to Figure 7).
This interrupt is handled by a default handler in the kernel. But this is where the Systemtap again interferes. The Systemtap script we write is converted into a kernel module, which is loaded into the kernel as soon as the script is run, using stap.
Systemtap creates its own handler for uprobes (present in the kernel module) to record the necessary data like arguments, values, etc, and hence, displays it to us. So, for each hit on the event, this handler gets called and the required action is taken (the action being specified in the script we write).
I wont go into the details of Systemtap due to space limitations. One can always find documentation regarding Systemtap.
So, whenever control reaches the marker location (currently being probed) in a program, it hits int3. The interrupt handler for int3 gets called and, sequentially, all the events mentioned above take place.
Tracing without Systemtap
Now, lets trace and probe manually using uprobes directly!
First, find out the mount point of debugfs. This virtual subsystem exists only in memory. We can find that out by using:
$ mount | grep debugfs |
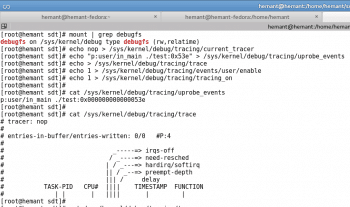
In Figure 8, we find that it is /sys/kernel/debugfs.
This contains a tracing directory and there are a few available tracers. We need the nop tracer.
# echo nop > /sys/kernel/debug/tracing/current_tracer |
In one terminal, lets find out the location of the marker we want to trace using the same readelf.
Lets suppose it is 0x40053e. Feed this address to uprobe_events in the tracing directory:
# echo p:user/in_main ./test:0x53e > /sys/kernel/debug/tracing/uprobe_events |
Note that we are probing on 0x53e and not on 0x40053e. The .text section in x86 starts at 0x400000 and this is taken care of by the uprobes interface. So just subtract 0x400000 from the note location we retrieved using readelf. In the context of uprobes, user is an event group and in_main is an event.
After making this entry, a directory named user is created in the events subdirectory inside the tracing directory. This corresponds to a group of events, of which, one event is in_main.
Clear out the trace file:
# echo > /sys/kernel/debug/tracing/trace |
Lets enable the event we want to trace, as follows:
# echo 1 > /sys/kernel/debug/tracing/events/user/enable |
In this case, we are enabling the complete event group which doesnt make a difference.
Start tracing, as follows:
# echo 1 > /sys/kernel/debug/tracing/tracing_on |
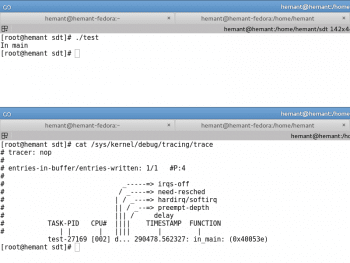
The tracing has begun. Now, just run the program in another terminal and then lets look at the trace:
# cat /sys/kernel/debug/tracing/trace |
It shows the task, its PID, the timestamp when the hit was recorded and the event name we are trying to trace. It also shows the hits (refer to Figure 9).
The arguments support is not yet present in the kernel. But this support is being integrated and will soon be available, presumably in the next kernel version.
This article will just familiarise you with SDT markers and their importance, giving you a little insight into their probing and tracing. Its up to you as to how you use them. Their importance can be gauged by the fact that QEMU uses over 500 markers. They can also be used in network programs to see the data received at the clients or at the server side. Libvirt uses them before making the RPC calls, so that if we probe on these markers, we will be able to know the data being sent and received. If you face any problem, just probe them, find out the relevant data and find out the source.


Nice article for beginners