Even though C was developed around 1973, it still elicits a fair share of interest from professional programmers. But beyond this, C is also the preferred language of academia. There is possibly not a single university in the world which does not have a C programming paper in its undergraduate curriculum. The destinies of C and UNIX have been intertwined ever since they were created. C is most powerful when it is used with UNIX. In fact, the system calls and commands of UNIX/Linux invigorate C programs. Unfortunately, in India, this language is most often taught using proprietary tools. To add insult to injury, the most widely used IDE is Turbo C++ for Microsoft Windows, a product of Borland Software Corporation, an erstwhile software company. The last stable version of this IDE was released in 1996, which makes it as old as many of the first-year undergraduate students who use it. In 2006, the Turbo C++ IDE was released as freeware, which effectively tells us that the software has become obsolete. But many people still cling to this tool, citing ease of use. I have had a difficult time convincing others how easy it is to use the Linux environment to program in C, and this article has its roots in my frustration over this argument. In this article, I have presented a few open source tools that will make the life of a C programmer comfortable in the Linux environment.
There are lots of open source tools that can be used to automate and simplify many of the steps involved in program development, using C. This list is in no way comprehensive, but the tools have been selected based on my experience and personal preferences. So the relevance of a particular tool might be debatable, occasionally, but the general idea is to introduce some useful tools to the interested user. Open source tools from the following categories will be discussed:
- Integrated Development Environments
- Build automation tools
- Revision control systems
- Debuggers
- Code coverage tools
- Static code checking tools
- Dynamic code checking tools
- Profiling tools
- Code formatters
- Documentation generators
- Open source libraries
Integrated Development Environments
An Integrated Development Environment (IDE) is an application that provides comprehensive facilities for software development. There are a large number of IDEs available for C programmers. Some of the popular open source IDEs include Code::Blocks, CodeLite, Geany, etc. In this race, Code::Blocks is the clear winner because of its ability to perform debugging, profiling, code completion, code coverage testing and static code analysis. Moreover, if you are an expert user of Code::Blocks, there wont be many practical situations for which you will need another tool for program analysis. Code::Blocks is a cross-platform application that will work on Windows, Linux and Mac OS X. The different compilers supported include GCC, MinGW, Digital Mars, Microsoft Visual C++, Borland C++, LLVM Clang, etc. The latest stable version is Code::Blocks 13.12, which was released on December 27, 2013.
Build automation tools
Build automation is the process of automating tasks like compiling source code to binary code, running tests and deploying the final application. Here too, we have a wide variety of tools to select from. Some of the popular tools include Make, Waf, and Automake. Waf is a Python-based tool which is gaining popularity. But Make is still the preferred tool for C developers. C program compilation can be automated with the Make utility by executing the command make. This will execute the Makefile, which should contain all the rules to automatically compile and build an executable from the source code. The rules mention prerequisite files and actions to be carried out in order to obtain a target file. You can download the source code of the C program and a Makefile from https://www.opensourceforu.com/article_source_code/sept14/make.zip. The zip file contains two C program files main.c and fun.c, a Makefile to build the source files and an image showing the output of Make.
There is some criticism about the Make utility regarding the rigid structure and syntax of the Makefile. Some criticism is based on the fact that Make offers too little in comparison with other tools like Waf. But, personally, I believe the best feature of Make is its simplicity and the criticism arises from the fact that it has been in use for the past 30 years. As often quoted, familiarity breeds contempt and with that, I rest my case.
Another tool which is often mentioned in conjunction with build automation is Automake, which is part of the GNU toolchain. Automake is an autotool used to automatically generate Makefiles for the Make utility.
Revision control systems
Another important tool that should be in the arsenal of a C programmer is a revision control system, a.k.a. a version control system. A revision control system is used when the changes made to the software being developed are very high, which makes it difficult to version properly. Here too, we have to choose from a wide list of tools, which include Mercurial, RCS, CVS, etc. Among all the different tools available, Mercurial is very simple and efficient.
The command hg init is used to initialise the repository by creating a directory called .hg. The hg status command tells us the status of the files being tracked by the repository. hg add file_name is used to add files for tracking. You can use the command hg commit to save different versions of your program files. hg log gives the details of different versions being tracked by the repository. And to revert to older versions, use hg revert ar version_number.
One common error message that haunts first time users of Mercurial is abort: no username supplied (see «hg help config»). If you get this error, you should edit the file .hgrc located inside your home directory and add the following lines of text:
[ui]
username = Your Name <your@email.com>
Debuggers
For novices, writing a program devoid of syntax errors is a difficult task. But the real difficulty occurs while dealing with run time errors. As the size of the program increases, identifying bugs that cause run time errors becomes more and more difficult. In order to debug large programs, we ought to get help from debuggers like GDB, DBX, DDD, etc. The debugger GDB (GNU Debugger) has become so popular and influential that the selection of a debugger is made very easy for most of the programmers. In fact, most other debuggers are influenced by GDB, with DBX being the only real competitor that is not based on the philosophy of GDB. The success of GDB even led to the development of a GUI-based debugger called DDD (Data Display Debugger) based on GDB.
GDB allows you to inspect various program parameters during and after program execution. Errors like segmentation faults are identified with relative ease using GDB. The C program fragment given below contains a run time error and GDB is used to uncover it.
int a=111,b=0,div; div=a/b; printf(After division result is %d\n,div);
The program compiles without any syntax errors but contains a logical error. The program should be compiled as follows to enable debugging with GDB: gcc -g program_name.c. The option -g enables built-in debugging support required by GDB. You can start the GDB debugger by using the gdb command. The transcript below shows the GDB session, which debugs the program gdb_example.c.
(gdb) file ./a.out
Reading symbols from /root/Desktop/gdb/a.out...done.
(gdb) run
Starting program: /root/Desktop/gdb/a.out
Program received signal SIGFPE, Arithmetic exception.
0x08048422 in main () at gdb_example.c:8
8 div=a/b;
The message clearly tells us that the run time error is due to division by zero. The command file is used to open an executable file for processing by GDB. The run command runs the program completely if there are no errors and stops processing with a diagnostic message at the first instance of a run time error. A very rich command set is available for fine tuned debugging of buggy programs and this makes GDB a tool of great importance.
Code coverage tools
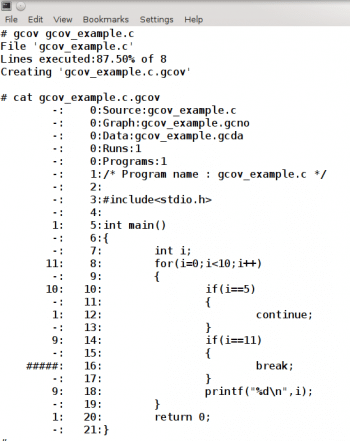
Source code coverage analysis tools tell the programmer the number of times each instruction in a program is executed. This information can be further used by the programmer to remove dead code and optimise the frequently executed instructions in a program. GCC offers a very simple and elegant tool for code coverage analysis called Gcov. The program should be compiled as follows to enable the proper working of Gcov: gcc -Wall -fprofile-arcs -ftest-coverage program_name.c. The option -Wall shows all the warnings, the option -fprofile-arcs is to deal with the execution of branch statements and the option -ftest-coverage adds the number of times each line is executed. After compilation, the program should be executed once before calling the Gcov utility. The following command calls the Gcov utility: gcov program_name.c. This will create a file called program_name.c.gcov which contains the output of Gcov. This file contains the program annotated with the line number and the number of times each line is being executed. Dead code that never gets executed is marked with the symbol #####. Figure 1 shows the output of Gcov for a program called gcov_example.c.
Static code checking tools
Static code checkers uncover security vulnerabilities and coding mistakes. Static code checking is carried out by analysing the source code or the object code. In static code checking the executable code is never analysed. The standard static code checking utility of Linux was Lint. But nowadays, the most popular static code checker for the Linux environment is Splint (Secure Programming Lint). Splint can uncover unused declarations, the use of variables before definition, type inconsistencies, unreachable code, ignored return values, infinite loops, etc. Consider the program buggy_program1.c for a demonstration of Splints ability to uncover potential errors.
#include<studio.h>
int main()
{
int i;
printf(\n%d\n,i);
i=A;
printf(%d,i);
i=++i+i++;
printf(\n%d\n,i);
}
The program can be processed with Splint by using the following command, splint program_name.c. This will list many unwanted warnings about potential threats which do not hinder program processing. These warnings can be suppressed by turning on the flag weak, as follows, splint -weak program_name.c.
The three potential logical errors in the program buggy_program1.c are uncovered by Splint after analysing the source code. The three potential problems are the use of variable i before initialisation, the assignment of a character value to the integer variable i and the use of the undefined expression ++i+i++. This shows us that Splint can uncover many potential threats unidentified by the compiler.
Dynamic code checking tools
Dynamic code checking involves the analysis of the executable file and system execution of a program to identify potential threats. Lets discuss a dynamic testing tool called Valgrind, which is used for memory debugging and memory leak detection. Sometimes even the most advanced programmers commit memory related errors. This makes Valgrind a tool thats sought after even by the most seasoned programmer. The working of Valgrind is explained with the help of the program buggy_program2.c given below.
/* Program name : buggy_program2.c */
#include<stdio.h>
#include<stdlib.h>
int main( )
{
char *ptr=calloc(5,sizeof(char));
ptr[5]=A;
}
This program is compiled to get the executable by typing the command gcc program_name.c. The executable created is used by the Valgrind utility to identify memory related vulnerabilities. There are multiple tools in Valgrind. The default and most frequently used one is Memcheck. The command for invoking Valgrind is valgrind executable_name. Valgrind will identify both the memory related errors in the program, the invalid write at location ptr[5] and the memory leakage of 5 bytes caused by not calling free( ).
Profiling tools
Profiling tools are used to analyse the performance of a program. They are used to analyse both the space and time complexity of a program. They also carry out a form of dynamic code analysis. The most widely used performance analysis tool for C is Grprof, an extended version of an older tool called prof. Profiling should be enabled while compiling the programs as follows. A program called gprof_example.c is used to analyse how Gprof works.
/* Program name : gprof_example.c */
#include<stdio.h>
void delay1( )
{
int j;
for(j=0;j<10000000;j++);
printf(\nIn function delay1\n);
}
void delay2( )
{
int k;
for(k=0;k<100000000;k++);
printf(\nIn function delay2\n);
}
int main( )
{
int i;
for(i=0;i<1000000;i++);
printf(\nIn function main\n);
delay1( );
delay2( );
return 0;
}
The Gprof utility should be enabled while compiling the program as follows: gcc -p program_name.c. Before calling Gprof, the program should be executed once. This will create a file called gmon.out. This, along with the executable file, is used by the Gprof utility to analyse the performance of the program. The command to call Gprof is: gprof a.out gmon.out. The time taken by various functions can be easily understood from the output of Gprof. If the program gprof_example.c is processed with Gprof, then you will observe that the execution time for function delay2( ) is roughly 10 times that of function delay1( ). This sort of information can be further used to identify functions that require optimisation.
Code formatters
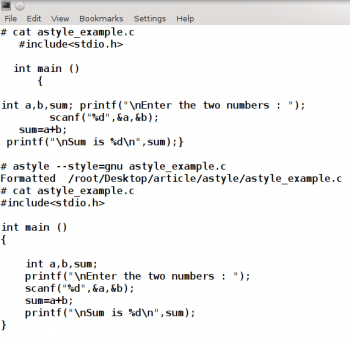
There are programming languages like Python and Occam in which the formatting style of the program is as important as the syntax to get the correct output. Such languages force the programmer to write well intended programs. But C is a free-form language, which does require proper formatting to obtain the correct output. The result of such freedom, if misused, often gives nightmares and sleepless nights to many a programmer. It is very difficult to debug programs if the code is not properly intended. Many different styles have been proposed for formatting C programs. Some of the very popular ones are K&R style, GNU style, Kernel style, etc. Problems arise when programmers with different formatting styles work together on a project. This problem can easily be solved by using a code formatter, which can translate code from one style to another. The most widely used code formatter in the Linux environment is Astyle. It supports multiple styles like Allmann, KR, GNU, etc, which are suitable for formatting C programs. Astyle also has other options to set parameters like the bracket style, tab size, indentation style, empty line padding, etc. Figure 2 shows a program called astyle_example.c formatted in a style that ought to be called chaos. If the program was a bit lengthier, it would have been impossible to fathom and any decent programmer would curse me for my insolence. But the figure also displays the magic of Astyle by changing the format of the program to GNU style. Yes, the ugly duckling has finally become a swan. The original unformatted program is stored in a file called astyle_example.c.orig.
Document generators
While writing efficient programs involves logical reasoning and is hence a task for the left hemisphere of the human brain, preparing documentation involves creativity and is handled by the right hemisphere of the brain. No computer in the world can perform creative writing, but automatic document preparation from specially commented programs has become a reality. Document generators are able to produce API documentation for programmers and user manuals for end users. Doxygen is one of the most widely used document generators and one that is highly suitable for the C language. It can cross-reference documentation and code, and the documentation part is written within the code. The program fragment shown below contains Doxygen based comments. The comments are ignored by the C compiler but they are recognised and processed by Doxygen.
/**
* @file doxygen_example.c
* @author deepu
* @date 15 Jul 2014
* @brief Example for using doxygen with C.
*/
Doxygen can be called as follows to process the C file: doxygen program_name.c. It can prepare documents in the form of HTML, XML, RTF, etc. Doxygen can also produce a Latex file as output, which can be further processed to obtain output in the PDF or DVI format. The example program given above uses only the basic tags. There is a large set of tags available to prepare all kinds of documentation.
Open source libraries
One severe criticism that C has faced over the years is with respect to the scarcity of useful library functions. To some extent, this is true, because when compared with languages like Java or Python, the number of library functions is comparatively less. But to overcome this drawback and to aid us in development, there are countless open source libraries that can be used along with the C standard library. The open source libraries range from the ones which allow us to draw images, to the ones which add security to our systems.
Some of the open source libraries widely used along with the C language include OpenGL, OpenCV, OpenSSL, etc. OpenGL is a cross language application programming interface to handle 2D and 3D vector graphics. It is used in CAD, flight simulation, scientific visualisation, etc. OpenCV is a library of functions that can be used for applications related to computer vision. Even though the latest interface is based on C++, OpenCV still maintains an older C-based interface. OpenSSL is an implementation of SSL and TLS. It contains a lot of cryptographic functions to be used in security related applications. And remember, this is just the tip of the iceberg; there are hundreds of useful open source libraries.
A thorough discussion of all the tools and packages described in this article will take up scores of text books. I hope this introduction will help you start a lifelong journey on interacting with the elegant language called C. The best thing about the tools discussed here is that they are all open source technologies. Hence, there are countless manuals freely available on the Internet. Go through the manuals and learn these tools; you can use them with many other languages and platforms because most of them are not limited to C.


