 Here’s an introduction to Firebug, which is used primarily for debugging client side scripts in real time and reducing development time. It also helps in creating bug-free code that can run across leading browsers seamlessly.
As the world of open source development evolves, debugging code is becoming a complex task. When it comes to browser client-side scripting that needs to be debugged, there are few tools available. This is especially true for runtime debugging on HTML, CSS and JavaScript tags. Firebug is one of the most popular add-ons of Mozilla Firefox for Web development. It is a free and open source plug-in with a BSD licence. Initially written in 2006, Firebug went through numerous updates, making it a favourite tool for Web software developers, as it certainly makes their lives easier.
Modern content management systems (CMS) such as Drupal, Joomla, WordPress, etc, empower Web development by embedding the client side code within their content entities. This, however, puts a burden on developers, when it comes to debugging the code in scenarios where it works fine on one browser but fails on another. Since CMS systems also add their own payload to the developer’s code, the resultant code obviously becomes very hard to debug. Firebug comes in as an essential helping hand in this situation by breaking code pieces into logical chunks on the screen. It introduces many features which are essential for Web development, such as inspecting HTML elements, debugging, editing, monitoring any websites CSS, HTML, JavaScript etc. At the time of writing, the most recent version of Firebug is 1.11.2 for Firefox 20. It has two major implementations: an extension (add-on) for Mozilla Firefox and Firebug Lite, which is for other browsers.
Why Firebug?
Firebug is a plug-in or add-on to the browser. What this means is that it has the same level of access and control on the Web page being rendered, as that of the browser entity. Firebug runs in the same security context as the browser, which gives it complete control on the objects and DOMs (document object model) created within a Web page.
Due to this, Firebug can perform multiple runtime operations on the client-side code, such as run JavaScript snippets, inspect HTML content, modify style sheets and layouts, etc. Optionally, it can also analyse network usage for a given page. This helps you find out how big the footprint of a page is including the images and other code resources it contains. Firebug also comes equipped with a nice GUI, which usually sits silently in the background and on the click of a button, comes to the foreground and starts providing useful information to the developers. It is possible to extend Firebug by calling its API library, and to enhance its features as a customisation effort.
The latest version of Firebug has advanced features such as editing CSS templates and adding attributes in real time, and viewing their effect on the Web page, dynamically. The developer can leverage this feature to try all style sheet combinations, check their effect on the user experience, ensure accuracy and then, accordingly, make changes in their release codes. This is a great help when trying out various style sheet objects such as table widths, foreground and background colours, fonts, etc. The newer versions can also help in object stack tracing for advanced developers.
The Firebug interface itself is very user friendly. Based on the nature of the code being developed and debugged, it is possible to instruct Firebug to only show certain types of errors, such as errors for only CSS code, or only for JavaScript, etc. This helps to avoid the clutter and results in quick debugging and faster development.
Installation
While there are no strict pre-requisites for Firebug installation, the computer must have the Firefox browser installed, preferably the latest version. It is important to ensure that no previous installations of Firebug are present, and if they are, they should be removed.
The latest version of Firebug can be downloaded from getfirebug.com/downloads and installed. Upon installation, it is advisable to close all browser instances and restart the browser.
Using Firebug
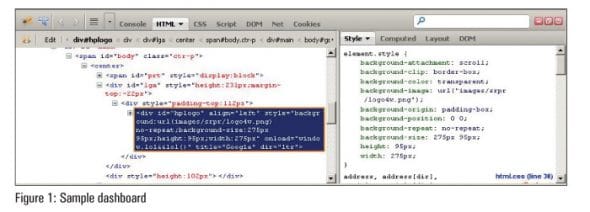
Firebug can be opened in any one of the following three waysby clicking on the icon on the right hand side of your browser’s navigation bar; by using a shortcut key (default : F12), or by right-clicking the mouse button and selecting ‘Inspect element with Firebug’. You can open it in a new window by clicking ‘Open firebug in new window’, i.e., the maximise button or as a bar at the bottom of your browser. This opens up a Firebug panel dashboard, which typically occupies the bottom half of the screen. Please refer to Figure 1, which shows a sample dashboard.

 Now let’s look at how to use this panel for debugging purposes. To explain better, let’s open the home page of Facebook. Once the page loads up, open up the Firebug panel and from the top menu of the panel, click the second button from the left, which reads Click an element in the page to inspect. This enables the highlighter on the browser page; so use the mouse to highlight the section to be debugged and click the mouse button.
Figure 2 demonstrates that the text reading Sign Up was selected from the Facebook home page and was changed to ‘Welcome’. As seen in that figure, the bottom left portion shows the exact HTML tag that was modified to achieve the result. On the right side of the panel, we can see the CSS code and tags which form that particular area of the page. This technique can be used for modifying any HTML tag, CSS styles, fonts, colours, layouts and JavaScript variables, thus demonstrating the power of Firebug. As can be seen in the same screen shot, the CSS section on the right also shows the line numbers of the .css file, which produces that page section. This really helps developers gain complete visibility of what needs to be modified in their code.
Firebug is both an inspector and an editor. All objects, i.e., HTML, CSS and JavaScript can be edited with a single or double click. When things go wrong, Firebug lets you know immediately, and gives you detailed and useful information about errors in JavaScript, CSS and XML. As you make changes in Firebug, you can see their result or effect in the browser instantly. All changes made in Firebug are in real time, so as you refresh your browser, it will show you the page before the changes were made. Firebug just helps you to get a particular CSS file with the line number or particular HTML tag on a page to make changes from your local machine, and then you can make permanent changes the way you want. It allows you to add new properties in CSS.
Now let’s look at a few advanced features of Firebug. As you can see on the panel, it has multiple views to drill down into the code, based on which code area needs to be targeted for debugging. There are two HTML panes, i.e., the Node view pane and the HTML side panels.
The Node view, which is on the left, allows you to inspect and modify the HTML tags of the page. When you hover the mouse over the HTML tags, it shows a section being highlighted on the page, which points to the location of elements placed on the page.
HTML side panels are on the right, and give more information about the styles of the highlighted elements.
There are four side panels: style, computed, layout and DOM.
Style: It shows you which CSS lines affect what part of your code. It also shows which style sheet effects correspond to that part, along with the line numbers. Computed: It shows the CSS with properties such as font size, type, alignment, etc. This gives information about how HTML renders that element.
Layout: It shows you the graphical box model of the element that you have clicked. It helps you to modify the values of the padding, margin and border by double clicking on it in real time.
DOM: It shows the document object model of the selected element. It’s useful for advanced client-side script debugging.
Console view
The console is for logging, tracing, profiling and the command line. The console shows JavaScript error message logs. It can also be used to run JavaScript commands.
CSS view
The main difference between styles in the HTML panel and CSS view is that it allows you to work on all CSS styles, and not just the highlighted one.
Script view
It allows you to jump to the particular section of the JavaScript that you have selected. It allows debugging of functions, shows the stack of functions in real time, the list of currently active breakpoints, etc. It includes JavaScript Debugger, which allows you to pause at any time. This feature is important to debug code snippets that are sluggish and need performance tuning.
DOM view
The Document Object Model is a great big hierarchy of objects and functions. Firebug helps you find DOM objects quickly and then edit them on the fly.
Net view
It gives information about how long it will take for your page to load or which request takes more time to load. The slowness of page loading can be attributed to static code, references to other pages, heavy images, etc. Net view helps you to pin point the exact section of a file which is slowing down the performance. It also gives suggestions regarding which images should be compressed for better performance, etc.
Cookies view
The cookies panel shows you the cookies on your current or selected page. You can deny cookies for a particular site, create cookies and also delete cookies, on the fly. Besides these features, there is a search box available on the panel which can be used to find elements or the sections of code being debugged. The panel dashboard can be detached from the browser, and be placed on screen as a floating entity for ease of use.
While Firebug is a self-contained environment for debugging, there are a few limitations which will hopefully be fixed in future versions. First, the CSS panel doesn’t allow the edit option. Second, while debugging HTML elements with hover properties, it is cumbersome to use Firebug to highlight a particular section and debug it. This is true in case of client-side slide show containers, which may or may not be using JQuery.


