
Proprietary network infrastructure monitoring software includes CiscoWorks LMS, Dhyan Network Management System, IBM Tivoli Network Manager, etc. There’s also a variety of open source network monitoring software available like Nagios, OpenNMS, Zenoss, etc. These cater to wide-ranging requirements, from just monitoring network traffic (Ntop), capturing packets for analysis (Wireshark), and infrastructure monitoring, to monitoring the entire network (various devices, hosts, services, applications, etc).
About Zenoss Core
According to the official website, the Zenoss project was started by Erik Dahl, a long-time network engineer, who had worked on numerous commercial network-monitoring systems. Zenoss Core delivers functionality to effectively manage the configuration, health and performance of networks, servers and applications, through a single integrated software package. Written in the Python programming language, it also uses the Zope application server, and MySQL for data storage.
Installation
Differing from the typical cryptic installation procedures for many Linux-based networking tools, which may include manual dependency resolution, various command-line options, making the required changes in OS modules, and more, Zenoss installation is an utter delight — just a double-click! All you do is install CentOS 5.2 (or any Linux OS of your choice), then download it and double-click the zenoss-stack-3.1.0-linux.bin installer (the version number may vary). The minimum hardware requirements are 2 GB of RAM and 20 GB of free disk space.
Configuration
Once installed, start configuring Zenoss using its GUI, which is accessible on http://localhost:8080. To enable it to be accessed from the network, you have to modify CentOS’s iptables firewall settings to open port 8080, by appending the following rule in the iptables file — /etc/sysconfig/iptables:
-A RH-Firewall-1-INPUT -m state --state NEW -m tcp -p tcp --dport 8080 -j ACCEPT |
Restart the iptables service by running service iptables restart as root for the rule to take effect. You can verify whether the port is now open using the following command:
#netstat -tulpn | grep 8080tcp 0 0 0.0.0.0:8080 0.0.0.0:* LISTEN 2751/.python.bin |
With the basic installation and configuration done, let’s look at how to configure important Zenoss features, with screenshots. The default Zenoss page has five important tabs, as seen in Figure 1. These are:
- Dashboard: This gives a consolidated picture of the monitored devices.
- Events: Details various events, sorted in terms of criticality.
- Infrastructure: Lists all monitored devices, lets you add/remove devices and set various parameters. The sub-menus also provide networks, various service classes and a network map for SNMP-enabled devices, among other functionality.
- Reports: Provides a detailed status of the devices, including the number of errors and the percentage of their resources that are available.
- Advanced: Various configuration settings, including the email address to send an alert to in case certain specified events occur, and the addition of Zenpacks (additional modules not available in the default Zenoss).

Now, let us consider some of the important menus in more detail.
Infrastructure
To add a host, device or service to the monitored list, specify the details here. The item can be classified as a router, host or service; whether it is a production or test unit, and more. For example, let’s consider a scenario where we add an Windows XP-based desktop, on which some important services need to be monitored. (For host monitoring, a ping response may be sufficient, but for services monitoring, the system must be SNMP-enabled.) Configuring the desktop to enable SNMP is a two-step process:
- Go to Control Panel –> Add/Remove Programs –> Add/Remove Windows Component –> Management and Monitoring Tools. Tick the “Simple Network Management Protocol” and “WMI SNMP Provider” boxes. Click OK, and insert the Windows CD, if required.
- Install agent software to monitor and manage the Windows machine — to maintain its Management Information Base (MIB), and respond to requests from network-monitoring systems (in this case, Zenoss). SNMP Informant is an excellent candidate; the standard version is available for free download, while the premium version requires payment.
To configure this host in Zenoss monitoring, under the Infrastructure menu, provide its IP address, and enter the required login name/password for the Windows PC. Configure the SNMP details, including the community (the default works for Windows). Select the services to be monitored. Once configured, the monitoring of the device and services begins.
Out of the total of 111 available services to monitor, for test purposes let us select four: vsmon (ZoneAlarm), Avast (anti-virus), SNMP and Eventlog (see Figure 2 for an example).

Go on adding as many devices, hosts and services that you want monitored. You can even use automatic network discovery, by giving a network subnet (e.g., 192.168.1.0/24 in our case) and add all the discovered IP addresses. (In this case, the network discovery was automatic, and the addition of two external firewall IPs was manual.) One of the internal Windows PCs was SNMP-enabled; all other devices were monitored only using ping.
Reports
Once the setup is complete and monitoring starts, the most important menu is Reports, to check the current status. Figure 3 shows the sample output for the All Devices report.
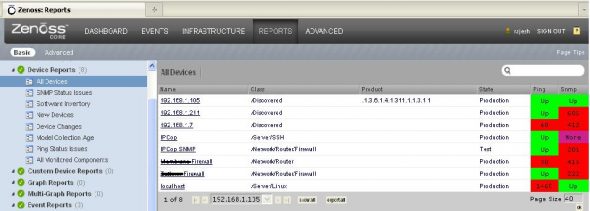
In this, we observe that:
- 192.168.1.105, ping and SNMP are both responding; for 192.168.1.211, there is a ping response, but not for SNMP. That’s because SNMP is not enabled on the CentOS machine.
- IPCop is configured to check only ping response; SNMP is not configured properly on it since its a test machine.
- The first firewall is down — there was no ping response. (This is a live firewall on the Internet.) The second firewall is up, and SNMP is not configured on it.
- For localhost, iptables is configured to disable ping responses; however, SNMP is responding.
As you can see in Figure 4, you can also check the availability reports for a range of dates that you specify.

Well, I’ve covered only important menus. Do explore the various Zenoss menus on your own; you will find all your network monitoring requirements are catered for!
In a nutshell, Zenoss Core is a simple-to-install, easy-to-configure and rock-stable open source network-monitoring system. It can be deployed effectively to monitor various devices, hosts, and services. Zenoss and all its components are available under the GPL license.
Stack installers of Zenoss are available for all important Linux distros, including Red Hat, CentOS, Fedora, Ubuntu Server, openSUSE, SUSE Enterprise and Debian — as well as for several versions of Mac OS (available for free download). Its virtual appliances are also available for VMWare on Linux/Windows.
References
- Official Zenoss website
- Zenoss forum
- Zope application server
- SNMP informant
- Wikipedia article on comparison of important network monitoring tools
- Zenoss Core Network and System Monitoring by Michael Badger












nice and informative post…. thanks
thank you for bringing all the good stuffs :)
My children were needing IRS 4562 several days ago and found a company that has 6,000,000 forms . If people are searching for IRS 4562 too , here’s
http://goo.gl/BsrC6K