 So how do developers launch their Android apps and market them on a war footing? While you may monitor qualitative comments from users, you simply cannot ignore usage analytics. Here are some guidelines on the key metrics you need to monitor, how to leverage this data, the steps to incorporating analytics in your code, etc. In this article, the example we’ve featured involves an Android app using the Flurry analytics service.
Web analytics services such as Google Analytics have been around for a while now, and it is no secret that many businesses rely on them to monitor their usage statistics (i.e., for quantitative data). In mobile applications, where usability is very important, app developers tend to rely on qualitative feedback from blogs, Twitter, alerts or customer reviews on the app store. But this alone is insufficient. Even while the focus of the feedback of the app’s usage hinges on its usability, analytics is the key to building and marketing successful apps. So what are the broad objectives of analytics, and how does it help app developers?
There are two broad objectives for using analytics. The first relates to enhancing the app’s features and its usability, by using metrics at the app level. These metrics address questions related to what the most navigated features are, how long the average user engages with an app, where the errors are being generated, etc. The second objective relates to user downloads. These metrics address matters like the number of downloads that happen in a week, the geographical spread of users, how fast users adopt to newer app versions, how a particular app performs in comparison with similar apps, etc.
Understanding these metrics helps plan enhancements to the app, and allows you to adopt effective marketing strategies, such as ad placement or cross-selling. While most providers offer a common set of metrics, they differ slightly. Some of the top providers include Flurry, Localytics, and Google Analytics for Android, which offer analytics for free.
How to incorporate analytics in your app
In a nutshell, most mobile analytics services use simple code that needs to be inserted into your app. Analytics code is inserted at points where data needs to be monitored. The data collected is stored on the smartphone, and periodically sent to the analytics software provider. There is no impact to the app’s performance due to the incorporation of analytics. Further, the data streamed to the server is immediately averaged, so no one incident can be tracked in isolation. This is important for the privacy of the users, as discussed in the last section of the article.
Given below are the steps involved in incorporating Flurry’s analytics service. The procedure for other solutions is similar.
Step 1
Sign up with Flurry, create an application and mention its category (games, lifestyle, social, tools, etc, which are similar to Android Market categories, which needs to be monitored. Flurry (like others) assigns a unique application key (or API key) for each app. This key will be used from the Android app to make a call to the Flurry service.
In Figure 1, the sample Android application laila is assigned a unique application key. You can, at any point, have up to 600 versions of the app that you can simultaneously monitor. All the versions have the same API key.

Step 2
Download the Flurry SDK for Android, which consists of a JAR file. All that you need to do is to add the JAR file to the application’s CLASSPATH. Here, we added FlurryAgent.jar using Eclipse’s Java Build Path and chose the Add External JAR option (see Figure 2). Import the Flurry library, com.flurry.android.*, in your app.

Step 3
Configure the AndroidManifest.xml file of the app to grant permission to collect analytics. The most important permission is Internet access, to transmit the collected analytics data to the Flurry servers. Additionally, if your analytics needs permission to track the location, you will have to take explicit approval from users in the Terms of Service (ToS) agreement.
In the example below, we used android.permission.ACCESS_COARSE_LOCATION that allows an application to access coarse location metrics by accessing cell and Wi-Fi based location data.
<uses-permission android:name="android.permission.INTERNET"></uses-permission>
<uses-permission android:name="android.permission.ACCESS_COARSE_LOCATION"></uses-permission>
Step 4 (optional)
Provide the Android Market ID to benchmark the performance of your app in comparison with other apps in the same category in the Android market. This is the package name of the main class of the application, which is used in Android Market. For example, the Market ID of the popular Angry Birds is com.rovio.angrybirds_lite.
Note: Android Market allows users to publish their application in the Market for others to download. Any developer who agrees to the terms and conditions for pricing, payments, license grants, and returns, can join the Market. The steps involve registration to Android Market with a Google account and paying up a small fee. This will enable you to have an account with an identity for your app. There are also other third party distribution channels — AndAppStore, Android Freeware, etc., which offer different payment models that a developer can leverage.
Step 5
Tracking the session’s length and events is very important. There are at least two ways to get each session’s length:
FlurryAgent.onStartSession (Context, String)is used in theonStartmethod of each Activity. Here, a Context object is either an activity or an event, followed by the String that is the application’s API key defined in Step 1.public void onStart() { super.onStart(); FlurryAgent.onStartSession(this, "LAJ5VGW1VM2N4LU7XW3P"); // your code }Flurry recommends the usage of
onStartfor each Activity in the app, and passing the activity itself as the context object.FlurryAgent.onEndSession (Context)is used in theonStopmethod of each Activity.public void onStop() { super.onStop(); FlurryAgent.onEndSession(this); // your code }onEndis added when a session is complete. One session can have multiple activities. It is recommended to add, for each Activity, a call toonStartSessionand end with anonEndSession, passing in the sameContextobject that was used to callonStartSession. The session continues under the following two cases:- So long as there is any Context that has called onStartSession but not onEndSession, the session will be continued.
- If a new Context calls onStartSession within 10 seconds of the last Context calling onEndSession, then the session will be continued instead of creating a new session. This way, a single session can span many activities. The default window of 10 seconds can be altered using the
FlurryAgent.setContinueSessionMillis(long milliseconds)before the first call to FlurryAgent.onStartSession.
In addition, you may need to track a number of events, where each “event” is anything that happens when the application is running and is of interest to you. A list of methods to track events is presented in the developer’s page. An example is shown below:
case MORSE_CODE:
           FlurryAgent.onEvent("Morse Code");
           //your code
           launchMorse();
           return true;
case ROSICRUCIAN_2:
            FlurryAgent.onEvent("Rosicrucian Decipher");
            // your code
Flurry can track the event that occurred, which represents the features of the app you want to track and build metrics.
It is crucial to remember that unlike Web applications, the source code cannot be changed after distribution to the user — so if you wish to change your analytics provider, it may be difficult. However, it has been observed that adoption of newer versions of a mobile app is extremely fast; in fact, these are often set to automatically update (with a user agreement to the clause in the ToS). One recent study on the Android site showed that within three weeks of releasing an app, only 3 per cent of users continued to use the older version.
Key analytic metrics
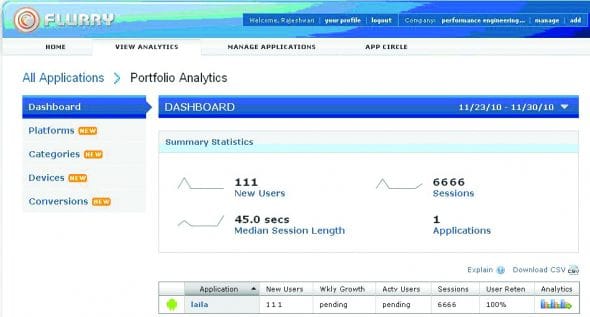
Analytics data can be extracted using APIs or by viewing the reports online on Flurry’s website. For access using the API, you may need to enable it via Flurry’s developer’s configuration panel. For example, the API request format given below, returns summary details such as event names, total number of times the event occurred, and the total number of sessions between the specified dates (see Figure 3).
http://api.flurry.com/eventMetrics/Summary?apiAccessCode=APIACCESSCODE&apiKey=APIKEY&startDate=STARTDATE&endDate=ENDDATE&versionName=VERSIONNAME

A comprehensive list of important metrics is given below.
- Individual app’s access details
- Number of sessions and number of users (new and active)
- Average session length
- User spread over geographies
- User retention
- Frequency of use
- User spread across versions
- Event details
- Exception and error logs
- Performance of your app with respect to other similar apps and categories. This is a useful benchmark for comparison.
- Type of hardware and software accessing your app
- Device models
- Carriers
- Firmware used
- Other popular metrics of your app
- Gender and age of the user (if the application uses Facebook Connect)
- Tracking stolen apps, with the knowledge of Android Market ID
- Tracking jail-broken devices accessing your app
Note: Crash logs are a crucial metric for a developer even after the launching of the app. While most crash-logging solutions, like in the case of Flurry, by default, send the crash reports silently whenever the “Force Close” dialogue box appears, there are other solutions that offer ways to intercept the event causing the crash and prompt the user to fill in comments concerning the crash. One crash logging tool for Android is ACRA Application Crash Report, which automatically pushes the report to a Google Docs form.
Privacy laws and guidelines
While the analytics data is crucial, there are limits to what you should be collecting from the user. Overall, it is recommended that you do not tap personal details like phone numbers, names, email IDs, or the UID of the phone. This is very crucial, as users are naturally and rightfully concerned about privacy.
Unlike the Apple Store that has iron-gloved control over its apps, Google only has guidelines for Android, and leaves the ultimate responsibility with the developer. Google’s guidelines recommend taking explicit user approval in the terms of service (ToS) for sensitive information like location tracking, and also letting users know details of what you will be collecting, and how you will be using it.
Feature image courtesy: Manop. reused under the terms of CC-BY-SA 2.0 License.


