In my previous article, we had a working setup of ftrace, and explored options to enable and disable it. In this article, we will explore a few more capabilities of ftrace.
Let’s begin with tracer options. The output of the tracing can be controlled by a file called trace_options. Various fields can be enabled and disabled by updating options in the file /sys/kernel/debug/tracing/trace_options. A sample of trace_options can be viewed in Figure 1.
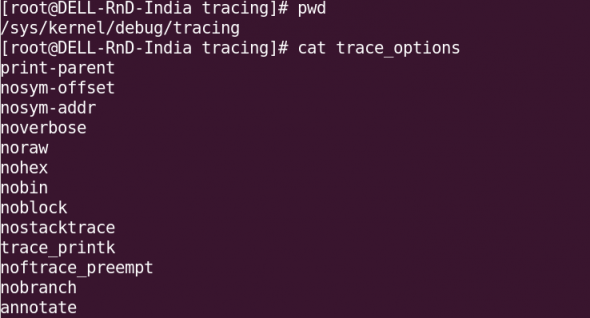
To disable a tracing option, a “no” keyword needs to be added to the start of the line. For example,
echo notrace_printk > trace_options. (Remember not to have a space between no and the option.) To enable a trace again, you could use, for instance, echo trace_printk > trace_options.
ftrace for a specific process
ftrace allows you to perform tracing even for a specific process. In the /sys/kernel/debug/tracing directory, the file set_ftrace_pid needs to be updated with the PID of the process you want to be traced. The traceprocess.sh sample script below shows how to capture the PID on-the-go, and enable tracing.
1 2 3 4 5 6 7 8 9 10 11 12 13 14 15 16 17 18 19 20 21 22 23 24 25 26 | #!/bin/bashDPATH="/sys/kernel/debug/tracing"PID=$$## Quick basic checks[ `id -u` -ne 0 ] && { echo "needs to be root" ; exit 1; } # check for root permissions[ -z $1 ] && { echo "needs process name as argument" ; exit 1; } # check for args to this functionmount | grep -i debugfs &> /dev/null[ $? -ne 0 ] && { echo "debugfs not mounted, mount it first"; exit 1; } #checks for debugfs mount# flush existing trace dataecho nop > $DPATH/current_tracer# set function tracerecho function > $DPATH/current_tracer# enable the current tracerecho 1 > $DPATH/tracing_enabled# write current process id to set_ftrace_pid fileecho $PID > $DPATH/set_ftrace_pid# start the tracingecho 1 > $DPATH/tracing_on# execute the processexec $* |
You can refine it with your own innovations. Run it with the command whose process you want to trace as the argument, as shown in Figure 2, where we traced the ls command.
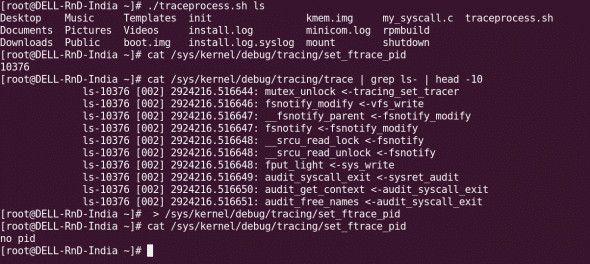
Once tracing is complete, you need to clear the
set_ftrace_pid file, for which you can use the following command:
:> set_ftrace_pid |
Function graph tracer
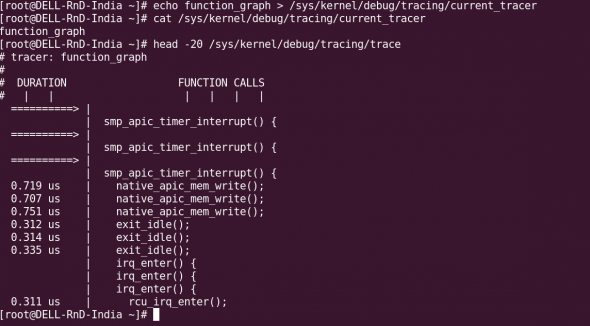
The function graph tracer tracks the entry and exit of a function, and is quite useful to track its execution time. Functions with a duration of over 10 microseconds are marked with a “+”, and those over 100 microseconds with “!”. To enable the function graph tracer, use echo function_graph > current_tracer. The sample output is as shown in Figure 3.
There are a lot of tracers; the entire list is in
linux/Documentation/trace/ftrace.txt. The tracers are enabled or disabled by echoing the tracer name into the current_tracer file.
Dynamic tracing
We can easily get inundated with the amount of data the function tracer throws at us. There is a dynamic way to filter just the functions we need, and eliminate those that we don’t need: to specify them in the file set_ftrace_filter. (First find the function(s) you want, from the available_filter_functions file.) See Figure 4 for an example of dynamic tracing.
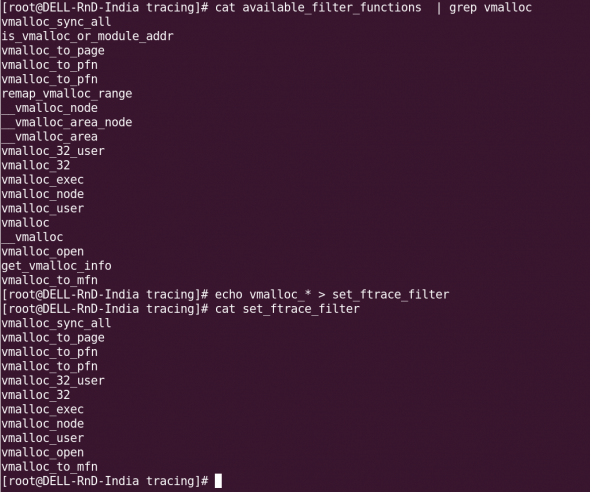
As you can see, you can even use wild-cards for the functions’ names. I used all the
vmalloc_ functions, and set them with: echo vmalloc_* > set_ftrace_filter.
Event tracing
Tracing can also be triggered when particular events happen on the system. Available system events are found in the file available_events:
[root@DELL-RnD-India tracing]# cat available_events | head -10kvmmmu:kvm_mmu_pagetable_walkkvmmmu:kvm_mmu_paging_elementkvmmmu:kvm_mmu_set_accessed_bitkvmmmu:kvm_mmu_set_dirty_bitkvmmmu:kvm_mmu_walker_errorkvmmmu:kvm_mmu_get_pagekvmmmu:kvm_mmu_sync_pagekvmmmu:kvm_mmu_unsync_pagekvmmmu:kvm_mmu_prepare_zap_pagekvm:kvm_entry |
For example, to enable an event, you would use: echo sys_enter_nice >> set_event (note that you append the event name to the file, using the >> append redirector, and not >). To disable an event, precede the event name with a “!”: echo '!sys_enter_nice' >> set_event. See Figure 5 for a sample event tracing scenario. The available events are listed in the events directory as well.
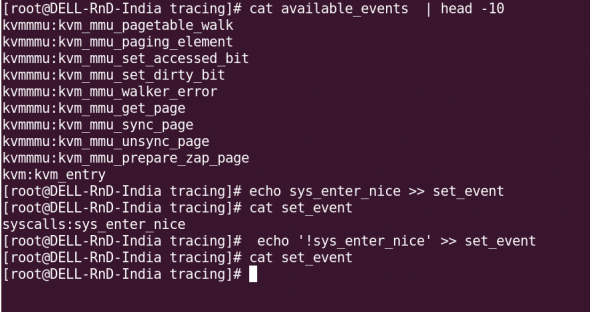
For further details about event tracing, read the file
Documents/Trace/events.txt in the kernel directory.
trace-cmd and KernelShark
trace-cmd, introduced by Steven Rostedt in his July 2009 post to the LKML, makes it easy to manipulate the tracer. Follow these steps to get the latest version, including the GUI tool KernelShark, installed on your system:
wget http://www.hr.kernel.org/pub/linux/analysis/trace-cmd/trace-cmd-1.0.5.tar.gztar -zxvf trace-cmd-1.0.5.tar.gzcd trace-cmd*makemake gui # compiles GUI tools (KernelShark)make installmake install_gui # installs GUI tools |
With trace-cmd, tracing becomes a breeze (see Figure 6 for sample usage):
trace-cmd list ##to see available eventstrace-cmd record -e syscalls ls ##Initiate tracing on the syscall 'ls'##(A file called trace.dat gets created in the current directory.)trace-cmd report ## displays the report from trace.dat |

KernelShark, installed by the
make install_gui step above, can be used to analyse the trace data in the file trace.dat, as shown in Figure 7.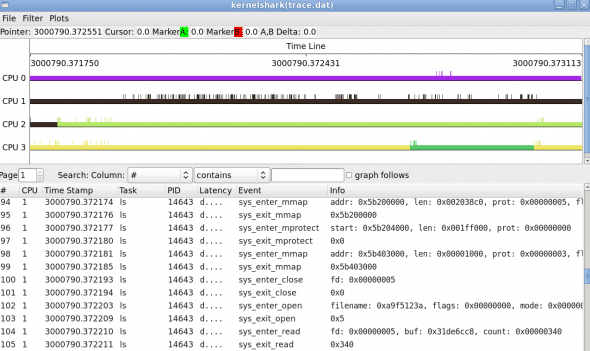
References
You can find abundant information in the following resources, which I used as references for this article:
- The Linux kernel’s
Documentation/tracingdirectory - Multiple articles from LWN
- KernelShark developer page






[…] with the above commands is shown in Figure 3.Figure 3: Sample trace outputTo be continuedWe will explore more ftrace options, and consider some tracing scenarios next month.ReferencesLinux kernel’s Documentation/tracing directory has been referred to. Apart from […]
I found that Ftrace is a powerfull tool.
I have an query for you
I
have an client and server and i want to trace the “sys_enter_write”
system call when the client sends the packet to the server.
Can you please specify how to do that?