
This article on Android application development introduces you to the command line utilities that come packaged with the Android SDK, all of which are extensively used to create an Android Application.
When using an IDE like Eclipse, the developer never realises the existence of these utilities, because IDEs provide an abstraction between the developer and the implementation of the process to create an application package. We, being open source enthusiasts and Linux users, should know how to build an application from the command line, and also be aware of exactly what is going on behind the scenes. This gives us a better understanding of the process of creating an Android application and will also help in debugging.
Under the Tools directory in the folder where the Android SDK is installed there are many command-line utilities. Let’s look at those that are used most often in the following sections of this article:
adbandroidddmsemulatormksdcardsqlite3traceview
Note: The following invocations/command lines assume that you have added the Android Tools directory to your $PATH, and thus do not need to precede each command with an absolute path to its location.
adb
adb stands for “Android Debug Bridge”. adb has a client-server mechanism, where the “client” is the Android Emulator instance, or the Android device that’s connected to the PC, and the “server” is your development machine (PC). The server communicates with client(s) through a daemon process which runs on the PC.
The adb server can have multiple clients: for example, two emulator instances and one Android phone connected via USB. To find clients available on the development machine, run the following command:
$ adb devices
Figure 1 shows sample results of running the command.
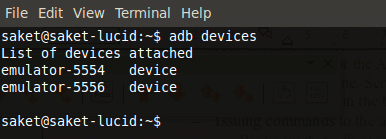
Having obtained the list of clients, we can run a command targeting a particular client/instance, by adding the -s <serial-number> parameter to the command, where serial-number is one of the device names listed by the adb devices command. For example:
$ adb -s emulator-5554 shell
Figure 2 shows the result of running such a command.

But to install an Android application into the connected device, the adb command given can be one of several, including
:
install <.apk file>— Installs the given Android application package on the device.shell— Presents you theadbclient’s console.logcat— Displays the contents of the device’s system log.
To see all the commands that you can use with adb, visit the official documentation.
android
This is a very important tool for Android application development. It lets you create and delete Android Virtual Devices (AVDs/emulators), create Android projects, and update the Android platform that you have on your development machine.
When you create a new AVD/emulator instance, android creates a dedicated folder for your AVD, with a user-data image, SD-card image, a mapping to the system image, and some other files required by each AVD. Each AVD does not contain a separate copy of the system image, but a line in the config.ini file maps the AVD to the system image, which is the target of the AVD. Before creating an AVD, you need to know the available Android targets supported by your version of the SDK. To find this, run the following command:
$ android list targets
Figure 3 shows the output of running this command.

Once you decide the Android version target ID for your AVD — for example, 1 for Android 2.1 (Eclair), or 3 for Android 2.2 (Froyo) — you can create the AVD with, for example, the command given below:
$ android create avd -n myandy_2.2 -t 3
Here, -n specifies the name of the AVD, and -t the target ID of the Android version for the AVD. Figure 4 shows you a sample of the queries/prompts for the new AVD’s hardware profile.
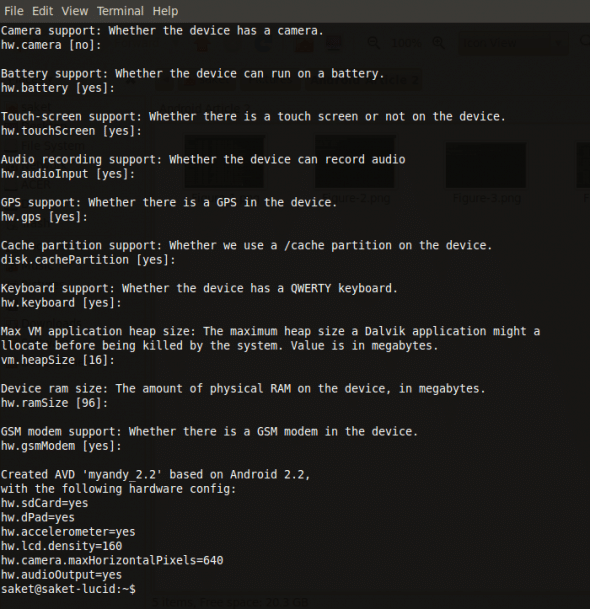
The android list avd command lists the AVDs created on the system; to delete an AVD, use
:
android delete avd -n <avd_name>.
The android utility is also used to create and update Android projects. The Eclipse IDE lets you create a new Android Project in a very user-friendly way, but internally, after collecting the required information, it actually issues a command like the one below (whose output is shown in Figure 5):
$ android create project --target 3 \
 --name HelloWorld \
 --path ./Workspace/MyAndroidAppProject \
 --activity HelloWorldActivity \
 --package home.saket

You can update the Android platform on your development machine with the latest Android releases, add-ons, etc., by launching the SDK and AVD Manager with the simple command, android. This is illustrated in Figure 6.
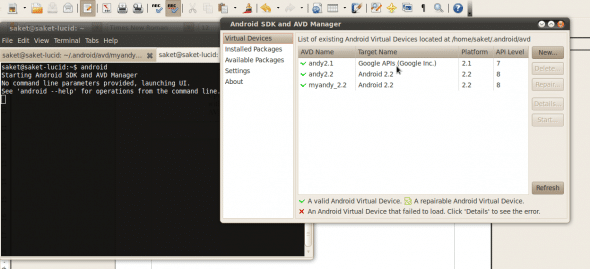
DDMS
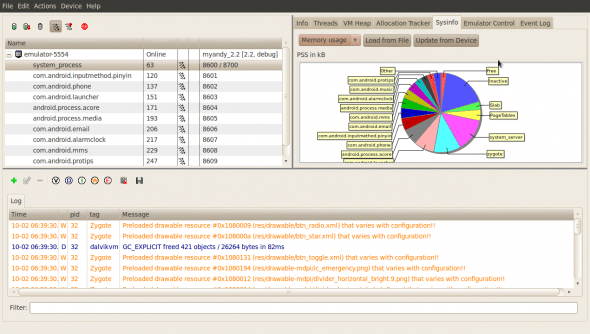
The Dalvik Debug Monitoring Service is a debugger tool that lets you debug an application running on the Android device, remotely, which is your development machine. To launch it, run ddms. Figure 7 shows what the DDMS screen looks like.
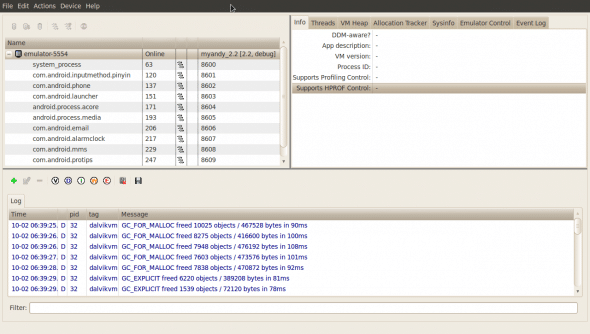
When the debugger launches, it automatically attaches to running emulator instances/devices. You can view the processes running on each instance in the left pane. The right pane has tabs to monitor process and emulator properties. You can see the memory usage of each of the applications running on the emulator, and also see the CPU load, etc., on the SysInfo tab (see Figure 8).
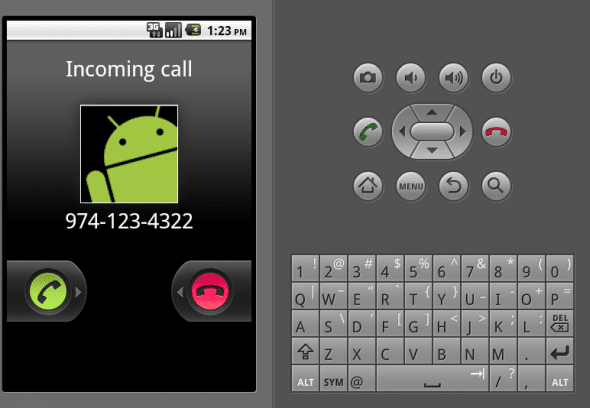
You can even test an application’s handling of incoming phone calls by simulating a call to the emulator instance, by entering the “calling” phone number in the “Incoming Number” field on the Emulator Control tab. Figure 9 is a screen capture of the emulator, showing the result of this action.
We can also view the heap status of the device, by causing garbage collection on the device, with the following steps:
- Select a process from the left pane.
- On the VM Heap tab, if you see, “No heap updates are available for this client”, then click the Show Heap Updates button at the top of the left pane, and then click the Cause GC button on the VM Heap tab.
You will now be able to see the heap update status, showing available memory on the device, along with some extra information about the heap.
Emulator
This tool is used to launch and control an emulator instance (an instance of an AVD created by the android utility). To launch an AVD, run
emulator -avd <avd name>
For example, emulator -avd myandy_2.2. We can use the emulator utility to control various hardware simulations of the emulator instance, like networking, media, etc., using startup options –> additional parameters on the emulator command-line. The general syntax is emulator -avd <avd name> <options> <values>. Some of the commonly-used options are -logcat, to view the console log while Android is booting; -shell to open a root shell on the emulator instance; and -no-boot-anim to disable the Android logo animation during boot.
Networking in the emulator
When an emulator instance is powered up, it always runs behind a virtual router/firewall and hence is isolated from the development environment. IP addresses used by emulator instances are in the range of 10.0.2.0-10.0.2.99.
Note: To access the development machine’s localhost, it is by default set to 10.0.2.2.
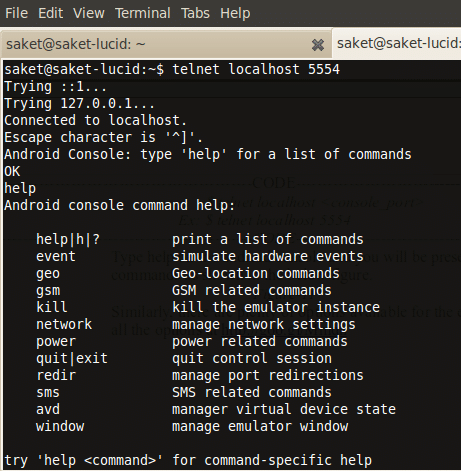
Once the emulator instance is running, we can connect to the instance’s control console using a simple telnet connection like telnet localhost <console_port>. For example, telnet localhost 5554. Type help at the Android console for a list of available commands, as shown in Figure 10.
Similarly, there are plenty of options available for the emulator; read about them here.
mksdcard
This tool lets you create an SD card disk image, with a FAT32 file system, which you can load into the emulator. The syntax is
mksdcard -l <label> <size>[K][M] <file>
For example: mksdcard -l S 512M saket.img. To “insert” this SD card image into an emulator instance, we use: emulator @myandy_2.2 -sdcard saket.img.
sqlite3
This command is used to enter the SQLite database system. You can use it to create and modify databases present in your emulator instance or device. To run the SQLite client, obtain a shell in the emulator instance and run the sqlite3 command. For example:
$ emulator @myandy_2.2 -shell
# sqlite3
sqlite3> .help
Generally, when you have a database-based Android application, the application database is stored in /data/data/<application package>/databases. For example, the email application’s database is in the folder /data/data/com.android.email/databases.
At the sqlite3 prompt, you can perform data definition and manipulation statements with SQL syntax. For example:
sqlite3> create table employee(
emp_id int,
emp_name varchar(20)
);
sqlite3> .tables
employee
traceview
This tool is used to profile applications. To be able to use it, there are some requirements for your application — its code must have a Debug.startTracingMethod(String tracename) method call at the beginning, and a Debug.stopTracingMethod() call at the end of the method. This method stores the tracing information onto an SD card — hence, your emulator instance should have an SD card image attached. The tracing writes a file at /sdcard/<tracename>.trace and hence we need to give the application permission to write the file on the SD card. This permission is given in AndroidManifest, as:
<uses-permission android:name="android.permission.WRITE_EXTERNAL_STORAGE" />
When the application is run in the emulator instance, you need to retrieve the trace file and feed it to the traceview utility, as follows:
$ adb pull /sdcard/HelloWorld.trace /tmp
$ traceview /tmp/HelloWorld.trace
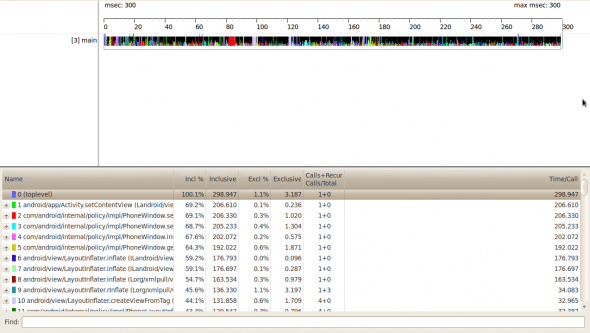
Now, you will be presented with a traceview window as shown in Figure 11, which is divided into two sections:
- the
timelinesection, which shows you the execution time of each thread in corresponding rows, and - the
profilesection, which shows you the time that is spent by the CPU inside a method, with some statistics included in separate columns.
Some other tools that are used internally are:
dx: To convert a.classfile to a.dexfile.monkey: To stress-test an Android application, this device console tool issues random events to a given application, such as touch, gesture, or click events.
To run monkey on the default Android email application, in a new emulator instance, issue the following command:
$ emulator @andy_2.2
$ adb shell monkey -p com.android.email -v 500
Here, monkey is passed on the application package name com.android.email, and the number of tests (500) to run.
I hope you enjoyed this article, and that the knowledge I’ve shared is helpful in your quest to learn more about Android. I will be back with other interesting information on Android Application Development in upcoming articles. We will also discuss building advanced applications on Android and for Android.







The Android app development utility is also used to manage and update different application projects. The Eclipse IDE can let you manage application projects in a very user-friendly way, but internally, after collecting the required information, it actually issues a command like the one below (whose output is shown in Figure 5):
From android to other the only this which is better is digital media.. and Digital agencies abu dhabi is a good option.
Great blog.