Most users and sysadmins would have come across a situation in which a desired application/program does not behave as expected in a system running SELinux. I have seen that, often, the blame falls squarely on SELinux—whether it is the culprit or not.
To successfully troubleshoot an issue with application performance in an SELinux-enabled system, follow the steps shown below to diagnose the problem:
- Determine whether the misbehaviour/error is due to SELinux.
- If not, troubleshoot the application.
- If yes, decipher SELinux error logs to understand why the denial occurred and take corrective action.
This article addresses the third point—i.e., how to decipher SELinux logs and take corrective action.
To determine whether the application misbehaviour/error is due to SELinux, switch SELinux to permissive mode:
[root@vbg ~]# setenforce 0
Now re-execute the earlier task. If you still face errors, SELinux is not responsible for the malfunction. The troubleshooting efforts need to be directed elsewhere (the application log files would be a good place to start).
If indeed the application behaved as desired on changing SELinux mode to permissive, it is time that you troubleshoot the SELinux logs.
Any denials by SELinux are recorded in the log files as Access Vector Cache (AVC) denials, since AVC is used by the rules engine.
SELinux Log files
If the Linux Auditing System (the auditd daemon) is running, SELinux denials are logged into the audit log file. The default audit log file is /var/log/audit/audit.log. In a situation where the auditd daemon is not running, AVC denials are logged in /var/log/messages.
In my opinion, it is prudent to enable the audit daemon and maintain a separate log file. The audit RPM should be installed by default on most Red Hat Enterprise systems.
If not installed, do so. In my system running RHEL 5, the RPM is audit-1.3.1-1.el5.
Also, do ensure that the auditd daemon is enabled to start at boot time. You can do that by issuing the following command:
[root@vbg ~]# chkconfig auditd on
To ensure that the auditd daemon has been enabled at start-up, issue the following command:
[root@vbg ~]# chkconfig --list auditd
auditd          0:off   1:off   2:on    3:on    4:on    5:on    6:off
As you can see, auditd will be executed whenever my system boots in run levels 3 or 5.
Once auditd is running, SELinux logs are written to the audit log file (generally /var/log/audit/audit.log).
A typical snippet of an AVC denial message, apart from the time stamp in my log file, is given below:
avc: denied { read } for pid=3579 comm="httpd" name="index.html" dev=hda3 ino=33001 scontext=user_u:system_r:httpd_t:s0 tcontext=system_u:object_r:tmp_t:s0 tclass=file
Let us look at the log and decipher its meaning:
avc : [result of SELinux rules] { access type } for pid="subject - Process Id Number" comm="subject - program command" name="object - name" dev="object - device" ino="object - inode number" scontext="subject - Security Context of Source" tcontext="object - Security Context of Target" tclass=" object - Class Type of target"
The above error can be interpreted by classifying the subject, object details and understanding the operation that the subject was performing on the object.
- Subject details in the log file:
- Subject Command = httpd
- Subject PID = 3579
- Subject Security Context = user_u:system_r:httpd_t:s0
- Object details in the log file:
- Object Name = index.html
- Object Class = file
- Object Partition = hda3
- Object Inode Number = 33001
- Object Security Context = system_u:object_r:tmp_t:s0
- Access details in the log file: Operation being Performed by Subject{ described in 1) above } on Object{ described in 2) above } = read
- Result: Result of the Operation{ described in 3) above } = denied
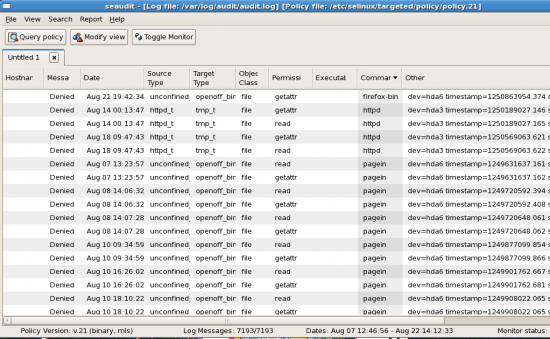
The above can also be viewed in an easy-to-understand GUI. To be able to view the log file in GUI mode, install the setools-gui package.
Once installed, you can view your log file by executing the seaudit command. A GUI window shall open, which is similar to Figure 1.

In the file menu, select Open Log and then select /var/log/audit/audit.log.
Once you open the log file, you can see the details of error logs generated graphically, sorted in various columns. You can right click on the message of your choice and look at the original log message.


