At some time or the other, many of us have felt the need to monitor different statistics regarding the machine connected to our network. SNMP (Simple Network Management Protocol) provides a standard set of network management tools to do so. Another useful tool is RRDTool, which is supposed to be an open source industry standard—a high-performance data logging and graphing system for time series data. Both these tools are really powerful and provide a base for many projects. One such project we will take a look at in this article is Cacti.
What is Cacti?
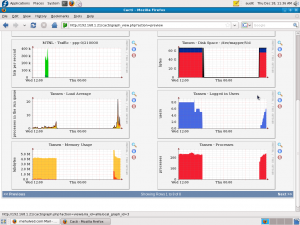
Cacti, according to the project website, is “a complete network graphing solution designed to harness the power of RRDTool’s data storage and graphing functionality. Cacti provides a fast poller, advanced graph templating, multiple data acquisition methods, and user management features out-of-the-box. All of this is wrapped in an intuitive, easy to use interface that makes sense for LAN-sized installations up to complex networks with hundreds of devices.” Figure 1 shows a preview of Cacti graphs.
With a PHP-driven front-end, Cacti has the ability to store the required information to create the graphs and populate them with data in a MySQL database. Apart from the ability to maintain graphs, data sources, and round-robin archives in a database, Cacti can even handle data gathering. As for those who want to create traffic graphs with MRTG (Multi Router Traffic Grapher), there is the obvious SNMP support.
For a complete list of important features, take a look at the following section.
Features of Cacti
The Cacti website has a complete section dedicated to Cacti’s feature set. We have reproduced the content here for your reference.
Graphs
- It allows you to create almost any imaginable RRDTool graph using all of the standard RRDTool graph types and consolidation functions.
- You can define an unlimited number of graph items for each graph, optionally using CDEFs or data sources from within Cacti.
- Automatic grouping of graph items allows quick re-sequencing of graph items.
Auto-padding support makes sure the graph legend text lines up.
Graph display
- The tree view allows users to create ‘graph hierarchies’ and place graphs on the tree. This is an easy way to manage/organise a large number of graphs.
- The list view lists the title of each graph in one large list, which links the user to the actual graph.
- The preview displays all the graphs in one large list format. This is similar to the default view for all CGI scripts for RRDTool/MRTG.
Data sources
- Data sources can be created that utilise RRDTool’s create and update functions. Each data source can be used to gather local or remote data to be placed on a graph.
- It supports RRD files with more than one data source and can use an RRD file stored anywhere on the local filesystem.
- Round robin archive (RRA) settings can be customised to give users the ability to gather data on a non-standard time span while storing varying amounts of data.
- It supports feeding paths to any external script/command along with any data that the user will need to ‘fill in’. Cacti will then gather this data in a cron job and populate a MySQL database or round robin archives.
- Data sources can also be created, which correspond to actual data on the graph. For instance, if a user wants to graph the ping times to a host, you can create a data source by utilising a script that pings a host and returns its value in milliseconds.
Data gathering
- It contains a ‘data input’ mechanism that allows users to define custom scripts that can be used to gather data. Each script can contain arguments that must be entered for each data source created, using the script (such as an IP address).
- The built-in SNMP support can use php-snmp, ucd-snmp, or net-snmp.
- It has the ability to retrieve data using SNMP or a script with an index. An example of this would be populating a list with IP interfaces or mounted partitions on a server. Integration with graph templates can be defined to enable one-click graph creation for hosts.
- It also provides a PHP-based poller to execute scripts, retrieve SNMP data, and update your RRD files.
Templates
- Templates allow the creation of a single graph or data source template that defines any graph or data source associated with it.
- Graph templates enable common graphs to be grouped together by templating. Every field for a normal graph can be templated or specified on a per-graph basis.
- Data source templates enable common data source types to be grouped together by templating. Every field for a normal data source can be templated or specified on a per-data source basis.
- Host templates are a group of graphs and data source templates that allow you to define common host types. On the creation of a host, it will automatically take on the properties of its template.
User management
- User-based management allows administrators to create users and assign different levels of permissions to the Cacti interface.
- You can even specify permissions per-graph for each user. This makes Cacti suitable for co location situations.
- All users can keep their own graph settings for varying viewing preferences.
Setting it up
The installation part is easy: it should be done from your distribution’s software repository. If not automatically pulled in, you need to install Apache, MySQL, PHP, php-mysql, net-snmp, php-snmp and rrdtool as dependencies for Cacti. If you want to install the latest version of Cacti manually, you can find it on the downloads page of the project website.
Step 1—Configure SNMP(Optional): Use the snmpconf tool to create a basic set-up of SNMP for each host as follows:
snmpconf -g basic_setup
Check the snmpconf man page for more information on it.
If you are using SNMPv3, you will have to create a SNMP user to allow read-write access as follows:
net-snmp-config --create-snmpv3-user -X <passphrase> -a <password> <username>
Now, in order to check whether your SNMP set-up is working or not, you can use a tool called snmpwalk as follows:
snmpwalk -v <version_numberglt; -c <community> <hostname/ip_address>
If this fails, you need to verify whether the snmpd service is running and your firewall is not blocking port 161 on the desired host.
Step 2—Configure PHP: You will need to uncomment/add the following lines to your php.ini file, if your distribution hasn’t done it automatically:
extension_dir = /etc/php.d
; Enable mysql extension module
extension=mysql.so
; Enable snmp extension module
extension=snmp.so
session.save_path=/tmp
file_uploads = On
Step 3—Configure Apache: Configure Apache Web server to serve Cacti through your browser. Edit your /etc/apache2/httpd.conf file to add the following line:
Include conf.d/*.conf
Add the following lines to /etc/httpd/conf.d/php.conf file:
LoadModule php5_module modules/libphp5.so
AddHandler php5-script .php
AddType text/html .php
DirectoryIndex index.php
Restart the Apache service to see the changes.
Note that the paths of the above Apache config files may vary from distro to distro. So, just in case you are unable to locate these files, consult your distribution documentation to find where the Apache configuration files are stored.
If your distribution installs Cacti to /usr/share/cacti, you can use vhost to point to Cacti directory. Please check the Apache documentation on vhosts for more information.
Step 4—Configure MySQL: Now, check whether your MySQL service is running (if not, start it). Create a database and a MySQL user for Cacti as follows:
CREATE DATABASE <db_name>;

GRANT ALL ON <db_name>.* ON '<db_user>'@'<hostname>' IDENTIFIED BY
<password>;
FLUSH PRIVILEGES;
Step 5—Configure and Install Cacti: If you have downloaded a tarball of Cacti from the website, untar it as follows:
tar xzvf cacti-<version>.tar.gz
Edit the configuration files to provide database information. Cacti is installed in /usr/share/cacti for most RPM-based distributions:
$EDITOR <path_to_cacti>/includes/config.php
$database_type = "mysql";
$database_default = "<db_name>";
$database_hostname = "<hostname>";
$database_username = "<db_user>";
$database_password
 = "<password>";
Now set permission for the Cacti user to access the rra/ and log/ directories. This step is needed to enable proper logging and creation of graphs:
cd <path_to_cacti>
chown -R  <cacti_user> rra/ log/
Edit the /etc/crontab file to run the poller to generate graphs:
*/5 * * * * <cacti_user> php <path_to_cacti>/poller.php > /dev/null 2>&1
Optionally, you can install spine to get a faster poller engine. Download it from www.cacti.net/spine_download.php and check compilation instructions at www.cacti.net/spine_install.php.
Now, open your Web browser and point to the Cacti directory by using the following URL: http://<address_of_server>/cacti
Go through the easy two-step installation process and you will come across a login screen. Enter the username and password as admin and admin, respectively. It will prompt you to set a new password for admin to secure your Cacti install.
That’s it! Your Cacti installation is ready to serve you.
Let’s configure, now
After you log in, the home page provides you with three options: Create devices, Create graphs and View. If you click on View, you will notice that there’s already a local host device showing a few graphs—Memory Usage, Load Average, Logged In Users and Processes. At this point, you will not be able to see any graphs, as they have not yet been generated. If you take a look after a few minutes, you will notice the graphs, but they will have NaN for all the values. Again, look back in five to 10 minutes, and you will see that the graphs have been filled up with polled statistics.
Now, let us try adding new devices (hosts) and new graphs, and show them on a new graph tree.
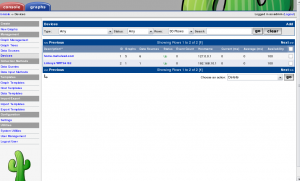

The following are the steps to create a new device:
- Go to Console tab on the Cacti Web page.
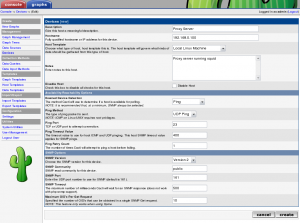
- Click on Create Device (see Figure 2).
- Click on Add at the top right side of the page.
- Fill in the fields shown in Figure 3. I’ve explained the important fields below:
- ‘Description’, as the name suggests, is the description of the device. For example, HTTP server.
- ‘Hostname’ is the fully-qualified hostname or IP address. For example, foo.bar.com or 192.168.1.1
- ‘Host Template’ is for selecting the template matching the host type. This is useful in getting templates while creating graphs.
- ‘SNMP version’ is the version of snmp running on the device. Version 3 requires the user name, password and pass phrase created with net-snmp-config earlier in the article. Version 1 and 2 only require the ‘community’ string.
- Click on the Create button at the bottom right corner of the page after you’ve filled in all the fields.
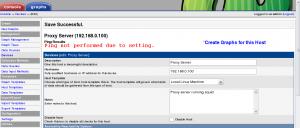
- The device has been added now. Scroll to the bottom of the page to see the status of the device (see Figure 4).
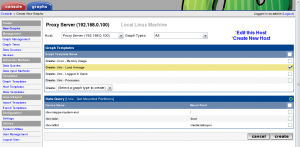
Now that you have created a device, you will see a link for ‘Create Graphs for this Host’ at the top of the page after creating the device (Figure 5). After clicking it, in the Create drop-down box under the ‘Graph Templates’ section (Figure 6), select the type of graph you want to create. Check the required fields in the ‘Data Query’ section, if any, returned by the SNMP lookup. Now, click on the Create button and your graph is ready.
If you want to add more graphs, go to the Console tab, click on Create graphs. Select the host you want to create a graph for, and follow the above steps to create a graph again.
I’m sure by now you’ve created a few graphs. At this point, you will notice that only ‘localhost’ is displayed; the other devices that you added are nowhere around. Since we would like to see them too, here’s the way to create a new graph tree:
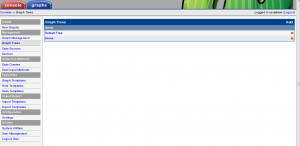
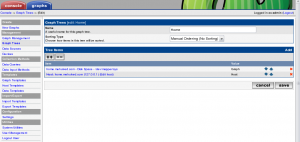
- Go to ‘Graph Trees’ under the ‘Management’ section listed on the left side pane (Figure 7).
- Click on Add at the top right side of the page.
- Enter the name of the tree, select the type of sorting, and click on Create (Figure 8).
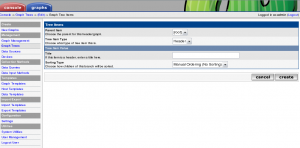
- Now, click on Add next to tree items to add items to the tree (Figure 9), and fill in/select the required information. The following are details of the parameters:
- Parent Item
- ‘root’ is the main trunk of the tree and all your items will be placed below this.
- ” is the branch of the tree under which you want to place your new item.
- Tree Item Type
- ‘Header,’ as the name suggests, is the header under which the rest of the items will go. It is useful in case multiple locations are being monitored—for example, departments in the office.
- ‘Graph’ is the graph to be displayed.
- ‘Host’ is the host to be displayed on the graph. This will show all the graphs under the host.
- Parent Item
- Click Create when you have finished.
If you need to edit an existing graph tree, you can do so in a similar fashion by selecting the ‘Graph Trees’ link under the ‘Management’ section on the left side pane of the Cacti page. Next, select the tree to edit. Then click on Add next to the tree items to add items to the tree.
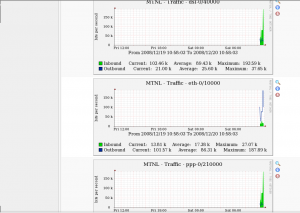
Have a look at Figure 10 now—its Cacti graphs are monitoring my MTNL traffic.
Cacti can handle functions ranging from various complex networks to different kinds of services. In the end, you always get pretty graphs for more or less everything. And we all know how monitoring graphs makes our lives so much easier.


