


Distributed monitoring involves the use of the underlying distributed infrastructure and communication protocols. Each server or device runs a client that acts as a node in the distributed monitoring network. The node collects metrics, is topology aware, uses gossip protocol for communication and contributes in monitoring other servers. This approach promises robustness and low latency failure detection.
Overlay network monitoring enables distributed Internet applications to detect and recover from path outages and periods of degraded performance, within seconds. This makes it possible to manage distributed systems such as VPNs (virtual private networks) and CDNs (content distribution networks). Accurate loss rate monitoring is critical to building adaptive overlay systems like streaming media frameworks.
In this article, we discuss the various building blocks of monitoring infrastructure, highlight feature capabilities, the significance of probe vs router models and look at new approaches to distributed network monitoring like packet doppler, gossip based monitoring and network tomography.
Network monitoring is the practice of monitoring infrastructure over a computer network to ensure service delivery to meet service level agreement (SLA) requirements and performance metrics for hardware infrastructure, networking equipment and repositories of virtual servers and software infrastructure.
With the convergence of telecommunications infrastructure with IP infrastructure to deliver seamless services over the network, operational practices have seen an overlap of frameworks, practices and protocols.
Protocols
With the introduction of carrier-grade Ethernet, the problem management lifecycle as captured by OAMPT (operations, administration, maintenance, provisioning and troubleshooting) has gained importance. The telecommunication management network model has FCAPS (fault management, configuration, accounting/administration, performance and security) capabilities. Since service delivery and service support is what the end users focus on, ITIL (Information Technology Infrastructure Library) captures the workflows.
CMIP (Communication Management Information Protocol) is a network management protocol standardised by the ITU (International Telecommunication Union). CMIP models management information in terms of managed objects. With the establishment of the IETF (Internet Engineering Task Force), a much more simplified yet comprehensive ASN.1 based network management protocol that could be used to design a hierarchy of managed objects was created. This is the Simple Network Management Protocol (SNMP).
Managed objects
In a network, a managed object is a device (router, switch), a system (server, blade chassis), a service (PostgreSql, Squid or HA-proxy), an entity (it could even be virtual machine or Docker instance) or a QoS (quality of service) metric that requires some form of monitoring and management.
A managed object is an abstract representation of network resources that are managed. It is defined in terms of the attributes it possesses, the operations that can be performed on it, and its relationship with other managed objects.
SNMP architecture
Simple Network Management Protocol (SNMP) is an IETF (Internet Engineering Task Force) ratified (multiple RFCs) standard for the Internet Management Protocol.
The notion of SNMP is expressed in terms of two complementary approaches:
1. The SNMP model of how to access the same information (communication over UDP and BER for encoding).
2. The SMI (structure of management information), which is a data model for representing a managed object as a MIB (management information base).
SNMP verbs
The basic verbs of the SNMP protocol are GET, SET, GETNEXT and GETBULK. An SNMP entity can also send asynchronous events, such as a TRAP and a NOTIFICATION. The verbs like GET and SET operate on individual variables of simple types, which can be scalar or located in tables.
Each SNMP data entity is expressed in terms of an OBJECT-IDENTIFIER encoded using TLV and a subset of ASN.1, which represents a node in a global tree. All SNMP definitions – MIBs, objects, etc – are identified by their OID in the global tree.
Thus, as part of the network monitoring strategy, it is common to define SMI for each of the network elements that need to be monitored and measured. An illustrative MIB fragment from mibdepot.com for D-Link is shown below.
D-Link: DLINKMGMT-MIB (SMIv2)
agentIpIfAddress OBJECT-TYPE
-- 1.3.6.1.4.1.326.2.20.1.11.1.3.2.1.2
-- iso(1). org(3). dod(6). internet(1). private(4). enterprises(1). marconi(326). systems(2). external(20). dlink(1). dlinkMgmtMIB(11). agentConfigInfo(1). agentIpProtoConfig(3). agentIpIfTable(2). agentIpIfEntry(1). agentIpIfAddress(2)
SYNTAX IpAddress
MAX-ACCESS read-only
DESCRIPTION
The IP address of the interface .
::= { agentIpIfEntry 2 }
JMX architecture
Java Management Extensions (JMX) is a framework and technology platform for building distributed and modular solutions to manage and monitor devices, applications and service-driven networks. Legacy systems can be adapted with the JMX infrastructure. While it is a Java based technology, JMX Beans and mbean server can be used to manage complex network topologies.
OpenNMS is an open source project that offers a feature-rich network management application platform.
Internet infrastructure
Architecturally speaking, most of the conventional models of network and system monitoring are (semi) centralised and can suffer from a single point of failure.
Measuring the characteristics of network traffic is critical to identify and diagnose performance problems. Some of the metrics are traffic volume, delay, delay distribution, packet loss rate, etc. The insight we gain is useful for designing distributed services.
The Internet is one of the most important distributed network infrastructures today. Interestingly, performance was not a design goal at the time of its conception.
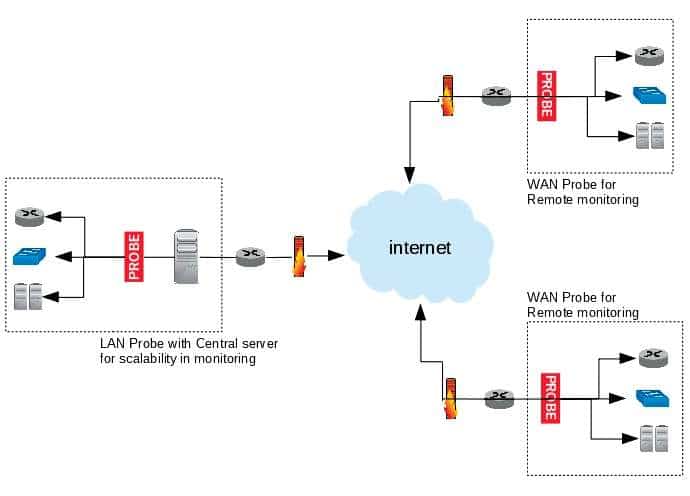
Most network measurement models utilise a monitoring approach that is either probe based (active) or router based (passive).
P2P network monitoring
The static design and rigidity of Internet architecture makes it difficult to innovate or deploy technologies in the core.
Consequently, most of the research and innovation has focused on overlay and peer-to-peer systems. A data structure like distributed hash tables (DHT) is used to implement protocols that keep track of the changes in membership and thus the attendant changes in the route. Tapestry, Chord, Kelips and Kademlia are the common implementation protocols.
In order to monitor such topology, lookup performance has often been measured with hop count, latency, success rate and probability of timeouts. For applications, lookup latency is used as a unified performance metric.
Cloud and container infrastructures
The rapid development of sensor technologies and wireless sensor network infrastructure has led to the generation of huge volumes of real-time data traffic. Cloud infrastructure needs to elastically handle the data surge, and provide computing and storage resources to applications in real-time.
As a result, software infrastructure that supports analytics for real-time decision support must have the ability to enable traffic data acquisition, and distributed and parallel data management. Intrusive network monitoring practices will neither work nor scale in dense cloud infrastructures. Cloud lifecycle management integrated with measurement is a value proposition.
Networked storage infrastructure
Storage networking infrastructures like SAN (storage area networks), NAS (network attached storage), NAS filers, VTL (virtual tape libraries), pNFS (parallel Network File System), DRBD (distributed replicated block device) clusters and RDMA (remote direct memory access) zero-copy networking have very stringent network performance requirements supported by backplane fabric technologies like data centre Ethernet, fibre channel (FC) and Infiniband. The common theme is very high throughput and very low latency.
Advanced Telecommunications Computing Architecture (ATCA)
Mobile data will grow ten times each year for the rest of this decade. A typical ATCA platform offers a mix of CPU, DSP, storage and I/O payload blades, together with up to four switch blades. The network and server infrastructure for mobile and fixed line services requires many line rate functions.
The functions include security, deep packet inspection (DPI), packet classification and load balancing. Line rate DPI enables advanced policy management and gives service providers full control of network resources. As network capacity increases, the line rates must increase from 10 Gbps and 40 Gbps to hundreds of Gbps, in the future.
Existing approaches of probe based network monitoring will not work and require the monitoring models to deeply integrate with line rate functions. Techniques like Packet Doppler represent a promising solution as they monitor SLA metrics.
Analytics based approaches
The current data-driven approach to defining metrics has led to operation analytics and route analytics, among other techniques, being used to manage and monitor heavy bandwidth overlay networks.
While topology discovery products are established, there are also many logical network overlays for the topology, including network routes. As a result, device-centric discovery mechanisms cannot capture the routes through the network.
Route analytics solves the configuration management requirements of organisations with highly meshed networks. By capturing the complex network topology relationships, route analytics systems can perform advanced configuration management, incident correlation and root-cause identification.
Performance metrics like latency, throughput and cost can be calculated since the analytics systems participate in the cooperative negotiations between routers. Real-time alerts can be generated as route paths become modified or there is a problem related to routing protocol. This can trigger polling, which leads to root-cause analysis through the event correlation system.
Packet Doppler
Delay and loss sensitive applications such as telecommuting, streaming media, gaming and live conference applications require stringent monitoring of service level agreement (SLA) metrics.
The traditional methods of end-to-end monitoring are not effective, as they are based on active probing and thus inject measurement traffic into the network.
Packet Doppler is used to measure and monitor the delay distributions of origin-destination (OD) pairs in an ISP network. A node could be an end-host, link, router or point of presence (PoP).
For each OD pair, tiny digests of real traffic (at both origin and destination) are listened to and recorded. The digests encode the time series information of the packets passing by.
Next, to extract all of the useful information out of packet digests, two decoding techniques are applied:
1. Sequential hypothesis testing (SHT) with Viterbi decoding
2. Sequential hypothesis testing (SHT) with iterative proportional fitting (IPF)
Keeping the structural constraints in the SLA measurements in mind, delay distributions are constructed, which are quite accurate.
The key advantages of Packet Doppler are:
- Passive technique
- Does not perturb real traffic
- Low storage and bandwidth overhead
- Detects burst events
- Detects packet loss events
Gossip protocol based monitoring
Gossip or epidemic protocols have emerged as a useful model to implement highly scalable, and resilient and reliable broadcast primitives. For reasons of scalability, participants in a gossip protocol maintain only a partial view of the system, from which they select peers to perform gossip exchanges.
The monitoring algorithm works by creating a network of nodes. Each server that is monitored represents a node. It also participates in monitoring the other nodes, by gossiping with them. Each node will periodically gossip its knowledge about the other nodes with a random node in the network.
The key concepts used by the algorithm are:
- Heartbeat value: Indicates the number of gossip rounds passed since the last communication with that node
- Gossip list: Contains a heartbeat value for each node
- Gossip interval: Time between two gossip messages sent by a node
- Cleanup time: Threshold value of the heartbeat before a node will be suspected to have failed
- Suspect list: List of suspects for each node, if the node is suspected to have failed
- Suspect matrix: 2D matrix, where each row is the suspect list of a node
When a node receives a message, it will update its own gossip list and suspect matrix if the received data is recent.
The protocol is generic enough and is used in NoSQL database design, in Akka router and cluster formations, among others, not to speak of distributed monitoring infrastructure.
Alerting
When a node detects that consensus is reached about a failure, it broadcasts this across the network. This can happen multiple times for a single failure, as the consensus can be detected by multiple nodes simultaneously.
In order to prevent multiple alerts, only the live node with the lowest identifier will send the consensus broadcast and alert. In case this node fails, the next live node will take this role. The other nodes will know an alert has been sent when they receive the consensus broadcast.
With this approach, the failure detection time can be significantly reduced as there is no single point of failure.
Since the monitoring software is running on each node instead of being an external entity, the resource usage of the server can be monitored as well. This can potentially provide more information in case of a failure, and by monitoring the system health, possible failure causes can be detected early, helping to prevent downtime.
Network tomography
Network tomography (NT) is the study of the internal characteristics of the Internet using information derived from end nodes. According to the type of data acquisition and performance parameters being tracked, network tomography can be classified as:
1. Link-level parameter estimation based on end-to-end, path-level traffic measurements
2. Sender-receiver path level traffic intensity estimation based on link-level traffic measurements
NT is a comprehensive model for building inferential network monitoring techniques that require minimal cooperation from network elements.
Network Coding (NC) was developed with the aim of improving the throughput of networks. NC packets introduce topology-dependent correlation, which can be used to improve the accuracy and reduction of complexity in choosing monitoring paths. The introduction of NC to NT extends the bottleneck discovery to P2P networks. This has implications on traffic routing and other network performance metrics.
Network monitoring capabilities
What started as a model of end-point monitoring has grown to span a spectrum of network leveraged monitoring and management capabilities, largely driven by the complexity of the entire network and infrastructure. The various aspects of monitoring categorised below are seen in metrics driven service level agreements (SLA).
Availability and uptime monitoring:
- Network device monitoring
- Cisco monitoring
- Device health monitoring
- Switch monitoring
- Network mapping
- Custom network maps
- WAN RTT monitoring
- VoIP monitoring
- Network traffic analysis
- Network configuration management
- IP address management
- Switch port management
Server management:
- Server management
- Server performance management
- Server monitoring
- VMware monitoring
- Hyper-V monitoring
- Citrix XenServer monitoring
- System health monitoring
- Service monitoring
- Windows service monitoring
- Process monitoring
- File/folder monitoring
Fault management:
- Network fault management
- IT workflow automation
- Email alerts
- SMS alerts
- Network monitoring tools
- Real-time graphs
- Switch port mappers
- Remote connection support
- SNMP trap processing
- Syslog monitoring
- Event log monitoring
- Threshold based alerting
- Integration with helpdesk
- Advanced alert management
- Customisable dashboard
- Service level management dashboards
- Network performance monitoring
- Prioritised reports
- Line of business teports
- Scheduled emailing of periodic reports
Data centre management:
- 3D data centre floor visualisation
- Systems management
- Data centre management
- Root cause analysis
- CMDB (configuration management database)
- Social connected IT
Enterprise grade scalability:
- Enterprise network monitoring
- Scalability in enterprise monitoring
- Remote network monitoring
Failover support:
- Third-party integrations and plugins
- Add-ons and plugins
- REST APIs
- Integration with industry frameworks (HP OpenView, Tivoli, etc)
Plugins extend the scope of management to include network changes, configuration management and IP address management.
Deployments:
- Automatic network discovery
- Discovery engine rule
- Monitoring templates
- Bulk configuration tools
Mobile dashboards:
- Android apps
- iOS apps
Productivity workflows:
- Automated workflows
- Intelligent alerting engines
- Configurable discovery rules
- Flexible templates
Open source tools
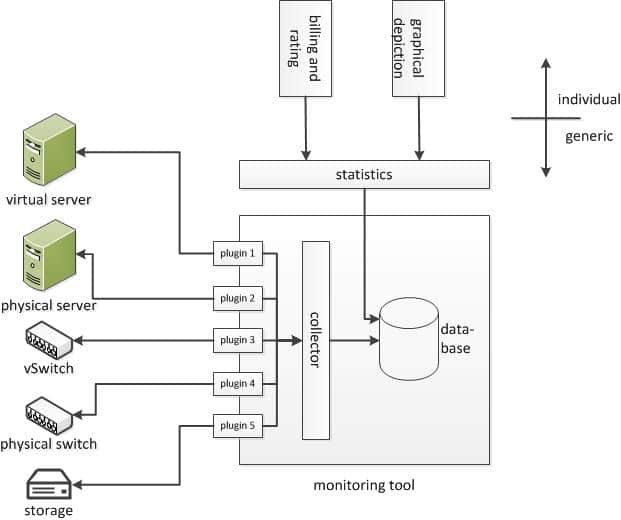
Now that we have an overview of the technology, protocols, practices and the key drivers for SLA driven network monitoring, let us take a quick look at some of the interesting open source monitoring tools. The generic architecture is seen in Figure 3.
collectd
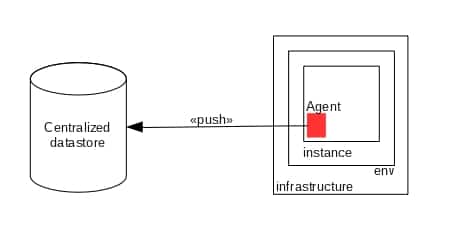
collectd is a daemon which collects system performance statistics written in plain C for performance and portability. Everything in collectd is done in plugins, and its memory footprint is so small that it runs even on embedded WLAN routers with OpenWRT.
collectd uses a data push model, wherein the data is collected and then pushed to a multi-cast group or server. It also implements a lightweight binary TLV based network protocol that works for data collection even over slow networks. Since data transmission and reception can be configured separately, the resultant models of network operation are – no networking, uni-cast, proxy and multi-cast.
collectd uses an in-memory self-balancing binary search tree to cache values in memory. This approach results in high resolution statistics being processed at scale. The multi-threaded design of collectd allows for multiple plugins to be queried simultaneously. It must be mentioned that influxDB, a time-series database, and Javascript based client-side frameworks like Grafana can also be used to build feature-rich custom dashboards.
Riemann
Another way to visualise the network is in terms of events raised by the various network elements, servers and applications as part of their processing capabilities. An outbound packet on a network interface constitutes an event a http reply is an event, a log entry written is an event, processing stage completed in Apache spark is an event, etc. Thus, any changes to CPU, memory, disk, database, application, services, infrastructure, IPMI, HT bus, etc, are events.
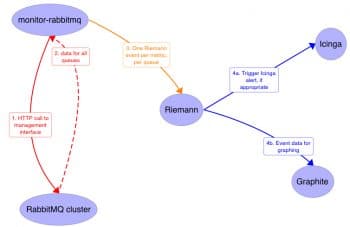
Riemann is an event stream processor with an asynchronous event model. It aggregates events and processes them with a stream language.
Figure 4 shows a typical deployment scenario, wherein Riemann is used to monitor a message queue cluster using multiple technology components.
OpenNMS
While we discuss OpenNMS architecture, an interesting feature beyond monitoring is its capability for log correlation. A Java-centric infrastructure will lean towards OpenNMS rather than Riemann.
Other monitoring tools that should be mentioned are Munin, Shinken, Sensu, Consul and Icinga2. Interested readers are welcome to explore them at leisure.
Networks, going forward
Carrier network infrastructure (CNI) and telecom operations management systems are growing at a compounded annual growth of 2.6 per cent, resulting in a US$ 2.7 trillion market. The speed of smartphone and tablet adoption, coupled with cloud infrastructure and video streaming, is disrupting centralised systems, driving network traffic and changing traffic patterns.
New technologies like software defined networking (SDN), network function virtualisation (NFV), 100Gbps+, Data Centre Ethernet, Packet Optical Transport Systems (P-OTS), 5G, LTE-advanced and small cell technology have the potential to change network cost structures, and improve network flexibility and resilience.
Tools and products that provide distributed network monitoring with tomography and real-time route analytics capabilities have the potential to be game changers.
References
[1] OATCA, Advanced Telecommunications Computing Architecture: http://www.atca.org/
[2] Jinyang Li et al (2004) Comparing the performance of Distributed Hash tables under churn. https://pdos.lcs.mit.edu/~strib/docs/dhtcomparison/dhtcomparison-iptps04.pdf
[3] Chen et al (2004) An algebraic approach to practical and scalable overlay network monitoring. SIGCOMM. http://dl.acm.org/citation.cfm?id=1015475
[4] Birman (2007) The promise, and limitations, of gossip protocols, ACM SIGOPS 41(5). http://dl.acm.org/citation.cfm?id=1317382
[5] Subramanian et al (2006) Gossip Enabled monitoring services for scalable heterogenous distributed systems, Cluster computing. doi:10.1.1.160.2604
[6] Wem Qiang Wang et al (2012), Smart Traffic Cloud: an infrastructure for Traffic Applications, Proc. of 2012 IEEE 18th Intl Conf on Parallel and Distributed Systems.
[7] Tongqing Qiu et al (2008) Packet Doppler: Network monitoring using Packet Shift Detection. ACN CoNext 2008, Madrid Spain.
[8] ODonnell, G (2004), Route Analytics enrich technology relationships, META group publication.
[9] Peng Qin et al (2014) A Survey on Network Tomography with Network Coding http://arxiv.org/abs/1403.5828


